Sound waves can be received only if a device
that will absorb a fraction of the incident energy
and convert it into a detectable form is placed
in their path. Such a device is called a receiver.
The proper type of receiver for a particular
application depends upon (1) the frequency,
amplitude, and form of the sound wave; (2) the
type of transmitting medium; and (3) the ultimate
object for which the sound energy is required.
A resonant receiver is designed to operate with
maximum efficiency at some particular frequency.
A nonresonant receiver is designed for use when
a reasonably uniform response is desired over a
given range of frequencies. If the primary
concern is faithfulness in the reproduction of
waveform, a nonresonant receiver is required.
However, if it is necessary to receive sound waves
of a particular frequency to the exclusion of other
frequencies that may be present in the medium,
a resonant receiver is required.
Most sound receivers function to transform the
mechanical energy that they absorb directly or
indirectly into electric energy. The electric
energy representing the sound signals may be
portrayed visually, or the sound signals themselves
may be reproduced as sound energy by a loudspeaker.
Human Ear
Sonar equipment that presents sound signals by
means of a loudspeaker is useless unless there is an
operator to hear and interpret the sound waves
radiated to the surrounding air. The capabilities
and limitations of the operator, whose task it is to
interpret the sounds issuing from the listening
gear, are important in determining the success or
failure of its mission. For this reason, the following discussion on the physics and psychology of
hearing is included, even though it is not strictly
a part of the theory of underwater sound. Note
that this discussion deals primarily with airborne
sound.
Confusion sometimes arises between the objective physical phenomenon of sound and its subjective perception by a listener. The reader is
doubtless familiar with a philosophical problem
that agitated the ancients, which was formulated
somewhat as follows: A tree crashes in a forest,
and no living being is present to perceive the fact.
Is there any sound?
Most of the lengthy arguments that were
expounded on this question could have been
avoided had there been adequate theories of sound
and hearing. Today sound means waves, which
travel in the air, water, or other medium. Thus
the answer to the crashing-tree question is yes.
Sound is to be distinguished from the sensation of
hearing, or auditory sensation, which is a phenomenon occurring in a human being or animal. There
was no auditory sensation in the crashing-tree
example. To clarify the distinction between a
sound and the sensation produced by a sound, the
sound is often called the stimulus. Ultrasonic
waves are sound, but they do not stimulate the
sensation of hearing in human beings; they are
thus not a stimulus of auditory sensation.
THEORY OF HEARING
In this study it is not essential that a physiological study of the ear be made. Of particular
interest here is that part of the inner ear called the
52
cochlea which has a major part in the hearing
process. It is a spiral tube, divided into galleries
by a longitudinal membrane-the basilar membrane, which is a sort of carpet of nerve endings.
The nerve endings of the basilar membrane are
transverse fibers that vary systematically in length.
The short fibers respond to sound waves of high
frequencies; the long fibers respond to sound waves
of low frequencies. That is, the position of the
point of maximum stimulation depends on the
frequency of the tone.
In response to a complex sound, the basilar
membrane vibrates with a certain pattern, perhaps
having several maxima, depending on the frequency components in the stimulus. The auditory
nerve endings are distributed along the basilar
membrane in such a way that they can transmit
this pattern to the brain, which interprets it in
terms of the pitch, loudness, and quality of the
sound. The location of the vibration pattern on
the basilar membrane determines the pitch sensation. Loudness is associated with the magnitude
of the vibration.
The relation between the perceived loudness of
a sound and the magnitude of the stimulus on the
basilar membrane is explained as follows: The
auditory nerve contains about 3,000 nerve fibers
which, analogous to a telephone cable, connect the
cochlea to the brain. Each nerve fiber responds
according to the "all-or-none" law; that is, when
it is stimulated sufficiently to respond at all, it
responds at full strength. The response of a nerve
fiber is analogous to the discharge of a condenser.
The strength of the discharge is independent of the
intensity of the sound, but the number of discharges per second does depend on the magnitude
of the stimulus in the following manner.
The discharge of a given nerve fiber is followed
by a "refractory period" during which the nerve
cannot react. This period is about 0.001 second;
thus no single nerve fiber can respond at a rate
greater than about 1,000 times per second. The
refractory period is followed by a "relative refractory period" of about 0.003 second during which
the nerve gradually recovers its sensitivity. Thus
a very weak tone of, say, 1,000 cycles per second
may cause a given nerve fiber to discharge no more
rapidly than about 300 times per second, whereas
with an intense tone of that frequency the nerve
may respond up to 900 times per second.
The number of responses of a given nerve fiber
depends on the strength of the stimulus; moreover
the number of nerve fibers excited increases with
the intensity of the stimulus because (1) a greater
area of the basilar membrane is activated and thus
the stimulus pattern on the membrane takes in
nerve endings over a wider area, and (2) the high
intensity excites nerve fibers having higher normal
thresholds of stimulation. It seems reasonable,
therefore, to correlate the sensation of loudness
with the total number of nerve impulses arriving
at the brain.
NUMERICAL DATA CONCERNING THE EAR
The preceding theory of hearing suggests how
the structure of the ear enables it to respond to
frequency and intensity characteristics of a sound.
Although it is a theory that has not been verified
in all details and is subject to revision, it should
help in understanding some of the pages which
follow. However, the following facts are independent of the correctness of this theory.
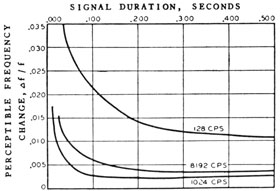
Frequencies of from 20 to 20,000 cycles per
second can be heard by a normal, young ear. A
change in frequency of less than one-half of 1 percent results in a perceptible change in the pitch of
pure tone. This phenomenon takes place at
10,000 cycles per second only if the listening level
is comfortably loud. As the duration of the tone
signal becomes shorter, the ability to hear pitch
changes decreases. This relation is shown in
figure 3-1, where the least-perceptible frequency
change plotted against the signal duration. It is interesting to note that at 1,024 cycles per second
Figure 3-1. -Threshold of frequency discrimination for several frequencies as a function of signal duration.
53
the length of the signal affects pitch discrimination
only if the signal length is less than 0.1 second.
This fact is important in doppler discrimination in
echo ranging.
The ear is most sensitive at frequencies between
1,000 and 5,000 cycles per second, where a sound
intensity of approximately 10-16 watt/cm2 can be
heard. A sound intensity of approximately 10-4
watt/cm2 produces a sensation of pain rather than
of hearing. Thus the ear has a dynamic range of
about 120 db at frequencies around 1,000 cycles
per second.
A rapid change of 1 db, or slightly less, in the
level of a pure tone can ordinarily be perceived at
all frequencies between 50 and 10,000 cycles per
second if the listening level is comfortably loud.
The ability to detect changes in level is less for
randomly fluctuating sounds, such as noise, than
for pure tones. However, a simple rhythmic variation is very easily perceived, particularly if it is
cyclic at the rate of about 3 per second.
The ear requires approximately 0.2 second for
the sensation of loudness to catch up with a sudden
increase or decrease of sound level. These dynamic properties seem to be determined by neural
rather than mechanical processes. They influence
the response of the ear to tones of short duration
such as those used in echo ranging.
Sounds having the same pitch and loudness may
produce different sensations if their spectra are
different. The general term "quality" is used to
describe the difference in the complex sensations
they stimulate. These differences may be sufficient to influence the masking of one sound by
another. Because masking is a primary factor in
preventing the detection of signals, its general
principles will be discussed in greater detail than
has been accorded to the other aspects of hearing.
THRESHOLD OF HEARING
The threshold of hearing may be illustrated by
the following experiment. A microphone is placed
near a sound source which produces a pure tone of
controllable intensity. Apart from this sound the
experimental location is to be very quiet. The
microphone converts the mechanical energy of the
sound into electric energy which can be used to
operate some device, such as an oscilloscope.
Beginning with a sound intensity of moderate
value, the intensity of the tone is gradually reduced.
The oscilloscope fails to operate properly
before the sound intensity has reached zero.
This minimum intensity to which the oscilloscope
responds depends on two factors. One is the
amount of energy dissipated in the various parts
of the microphone; the other is the self-noise of the
oscilloscope, the microphone, and the circuit.
The oscilloscope will not operate properly unless
the signal is at least as intense as the self-noise.
The minimum sound level that will cause the
device to operate properly is its threshold.
Suppose that the receiver is now replaced by a
human ear, and the same procedure is followed.
A precisely analogous situation results, and for
much the same reasons. The ear receives the
sound energy incident on it, is stimulated mechanically, and the mechanical energy then is converted into some form of nerve energy which
activates the brain. Some of the incident energy
is dissipated in this process. Corresponding to
the self-noise of the receiver, there are sounds
generated by breathing and by the circulation of
the blood. Thus there is a minimum level which
must be exceeded by a sound before it can be
heard. This threshold of hearing corresponds to
the threshold of the microphone-oscilloscope
system.
The value of the threshold of hearing differs
among people. We say that their acuity is
different. The average value of the threshold of
hearing also depends on the frequency. At 64
cycles per second the pressure of the threshold of
hearing is 0.12 dyne/cm2; it decreases more or less
uniformly with increasing frequency up to about
3,000 cycles per second, at which frequency the
pressure is 0.000041 dyne/cm2. This value corresponds to the lowest limit of sensitivity mentioned earlier. Above 5,000 cycles per second it
increases with frequency until at 18,000 cycles per
second it is 4.1 dynes/cm2.
MASKING
Under all ordinary circumstances, we hear
many sounds at once but are usually able to concentrate on the wanted sounds and ignore the
unwanted background. This background is
always present. Even in a very quiet place the
self-noise produced by the normal internal processes of the human body becomes audible. Thus
there is complete analogy between the ear and an
electronic receiver of sound. This analogy is
54
close enough to permit the frequent use of the
word "receiver" with reference to the ear as well
as to electronic devices.
Although unwanted sounds can be ignored to a
considerable extent, their presence does interfere
with the ear's ability to detect another sound.
This interference is called masking. Masking is
the increase of threshold level caused by the
unwanted sound.
The level at which a particular sound becomes
audible differs from the threshold of hearing by an
amount depending on the extent to which the
background noise masks the signal. This level is
the masked threshold; it is the level of the signal
when it is audible above a particular background
noise 50 percent of the time. The masked
threshold therefore applies to the signal-noise pair,
not to the signal alone, although it is measured by
the level of the signal alone. The value of the
masked threshold is, however, determined by the
level of the noise. Raising the level of the noise
raises the masked threshold of the signal.
The variable acuity of a listener introduces the
need for the phrase "50 percent of the time." Not
only does the threshold of a signal under identical
conditions vary from individual to individual, but
the same individual sometimes hears a signal and
sometimes not, even though the levels of signal
and masking noise are the same on the various
occasions.
This problem may be clarified by describing a
typical experiment designed to measure the
masked threshold. Arrangements are made so
that a number of listeners will hear the background
noise at a constant and known level. Other
arrangements are made for producing a series of
signals at various levels. Care is taken so that
the listeners cannot determine when or at what
level a signal is produced except by hearing it;
they receive no cues from the person administering
the test nor from each other. The administrator
records the level of each signal and, after a suitable
interval, instructs each listener to vote yes or no
as to whether he heard the signal.
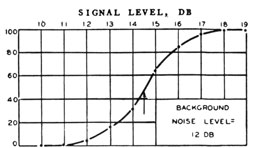
Each level of the signal is presented 5 times to 10
listeners, so that the total number of votes for each
level is 50. The recognition probability is the
percentage of yes votes for a given level. This
probability is plotted as a function of level in
figure 3-2.
Figure 3-2 -Probability of recognition of a pure tone in a
background of a noise at a constant level of 12 db.
Note that, there is no abrupt transition from
inaudibility to audibility. Instead, the probability of hearing the signal increases gradually
from zero to 100 percent over a 5-db range of
levels. This complication was not considered in
discussing threshold levels in the preceding pages.
Fundamentally, there is no one level at which the
signal is "just audible." To avoid confusion,
threshold levels are usually defined as the level at
which the recognition probability is 50 percent;
but, when necessary, other percentages may be
used, provided they are specifically indicated.
Figure 3-2 shows that the 50-percent masked
threshold is 14.5 db, the 90-percent threshold is
16.4 db, and the 10-percent threshold is 12.6 db.
This difference between the threshold level of
the signal and the level of the background is called
the recognition differential. In the example the
recognition differential for 50-percent recognition
is thus 2.5 db (14.5-12.0).
PSYCHOLOGICAL CHARACTERISTICS OF
SOUND
How does the ear distinguish between a specific
sound and all the other sounds that form a background for it? Everyday experience suggests the
answer. A boatswain shouting orders must rely
chiefly on his ability to produce sounds of an
intensity great enough to override the clamor of
winches and other noises. A shrill whistle produces a sound that is audible, even though the
intensity of the background is incomparably
greater than that of the whistle. In this case the
perception is due partly to the pitch difference
between the signal and the background noise, and
partly to a decided difference in the quality of
the two sounds. A rhythmic drumbeat is audible
over many noises. Before the days of telephone
and radio the common method of transmitting
55
orders to masses of troops was to use drumbeats
of various rhythmic patterns. Bugle calls with
very decided rhythm utilized the advantages of
all the factors mentioned.
To sum up, the sensations produced by sound
have at least four distinctive characteristics: (1)
Loudness, (2) pitch, (3) quality, and (4) time
pattern. In the recognition of a particular sound,
all four of these characteristics probably contribute to differentiate it from others heard simultaneously. In experiments, however, the effect of
each characteristic can be isolated.
Loudness, pitch, and quality are psychological,
rather than purely physical, terms. That is, they
directly characterize the sensation and only indirectly the sound. It is customary to say loosely
that loudness is determined by the level of a
sound, pitch by the dominant frequency, and quality by the spectrum. This explanation is over-simplified. A more careful examination discloses
that in determining any one of the three, all the
physical characteristics of the sound play a part.
Loudness, it is true, is determined primarily by
the level of the sound, but it is influenced also by
the frequency and spectrum. It has been demonstrated experimentally that a moderately high
frequency is perceived as being louder than a low
frequency of the same intensity. This fact is
almost implicit in the discussion of the threshold
of hearing given above. If the frequency exceeds
about 14 kc the reverse is true, and ultrasonic
sound of any level is inaudible. Pitch, in its turn,
is determined largely by the dominant frequency
of the sound waves but is influenced also by the
level and the other characteristics of the spectrum.
Quality is principally a matter of spectral distribution; and the time pattern may consist of systematic changes in any of the other three psychological characteristics.
One point is worthy of particular emphasis.
Ignoring the fact that intensity is not the only
factor that determines loudness, we may inquire
as to the mathematical relation between intensity
and loudness. It appears that this relation is not
a simple proportionality-that is, when one sound
is said by most people to be "twice as loud" as
another, the intensity of the one is not twice, but
approximately 100 times, the intensity of the
other. In general, loudness is more nearly proportional to the level of the sound in decibels. A
barely perceptible increase of loudness usually accompanies a sudden increase of 1 db in sound
level, whether the original level was 5 or 50 db.
Another characteristic that can be used to differentiate sounds is their direction of arrival. In
simple cases, this direction coincides with the
direction of the source from the listener. The
binaural effect is the ability of a human with two
ears to determine the direction of a sound source.
This sense of sound direction depends primarily
on the difference in phase (or time) of the waves
reaching the two ears, although it depends partly
on the difference in intensity of the sound received in the two ears. The binaural effect is
similar in principle to the split transducer used
with bearing deviation indicators (BDI).
In the early days of sonar, attempts were made
to use the binaural effect to determine the direction of underwater sound. These listening devices used two receivers placed along a baseline
varying from several feet to several hundred feet.
This procedure virtually increased the baseline
between the two ears.
An early device of this type, designed for underwater listening, consisted of two hollow rubber
spheres mounted on the ends of a pipe about 4
feet long. Projected through the hull of the ship,
the receivers were separately connected over lines
of equal length to the two ears. The tube might
then be turned until the sound appeared centered
in the head; at which time it should be on a line
perpendicular to the baseline of the receivers.
Doppler Effect
DEFINITION
The Doppler principle applicable to all wave
motion was developed by the Austrian physicist,
Christian Doppler (1803-1853). This principle
shows that when there is a relative motion between
the source of a wave motion and a receiver the
apparent frequency at the receiver differs from
the frequency at the source. The Doppler principle has important operational applications in
sonar.
If an observer is moving toward a source of
sound, he hears a tone the pitch of which is higher
than when he is at rest. If the observer is moving
56
away from the source of sound, he hears a tone the
pitch of which is lower than when he is at rest.
Thus the frequency of the sound appears to
increase when a observer moves toward a source
and appears to decrease when he moves away from
it. Similarly, if the source is moving toward the
observer, the frequency is higher; if the source is
moving away from the observer, it is lower.
The apparent frequency of the sound is found as
follows: When the observer is at rest, the number
of waves he receives each second is Fo, the true
frequency of the sound. When the observer moves
toward the source, he receives more sound waves
in each second than when he is at rest. If his
mean range rate is dR (in feet per second), the
additional number of waves received per second
are those that occupy the distance by which the
range is changed in 1 second. Because the distance between successive waves is the wavelength
λ, this number is dR / λ.
If the relation for the velocity v of the sound,
v= Foλ, (3-1)
is used, the number of additional waves received
is FodR / v. The apparent frequency, F, is the total
number of waves received each second and is
therefore given by
F=Fo(1 + dR/v). (3-2)
When the observer is in motion away from the
source, the plus is replaced by a minus-
F=Fo(1 - dR/v). (3-3)
If the source is receiving echoes from a target,
the Doppler effect occurs twice, so that the frequency
of the echo FE, received at the source is
FE=Fo(1 ± 2dR/v). (3-4)
Equation (3-4) gives the apparent frequency of
the echo when the range rate is dR; the positive
sign is used if the receiver and the source are
moving toward each other, the negative if they are
moving away from each other.
The equations apply to the ultrasonic frequency
of the sound in the water. To make this sound
audible, the received waves are heterodyned in
the receiver. This heterodyne receiver reduces
the frequency by a constant amount. Note that
this reduction is subtractive and not proportional-that is, the receiver subtracts a constant amount,
FH, from the received frequency, FE, so that the
audio frequency of the output is
fE=FE-FH (3-5)
If this equation is applied to equation (3-4)
the audio frequency of the echo is
fE=Fo-FH±(2FodR)/v, (3-6)
or
fE=fo±(2FodR)/v, (3-7)
Here fo=Fo-FH is the audio frequency of the
echo for a zero range rate. The difference fE-fo;
that is, the quantity ±2FodR/v; is called the absolute doppler shift. It is proportional to Fo, and
independent of FH and fo. This fact is very important because the transmitted frequency, Fo, is
much greater than the heterodyned audio frequency fo. Because the Doppler effect is to shift
the frequency by 0.7 cycle per kilocycle per knot of
range rate, if dR is expressed in knots and Fo, in
kilocycles, the doppler shift is
fE-fo=0.7FodR cps (approx). (3-8)
If Fo, is 24 kilocycles,
fE-fo=17dR cps (approx). (3-9)
This shift can be very appreciable. If the sonar
ship and the target are on opposite courses, and
one is moving at 25 knots and the other at 20,
the shift is 45 X 17=765 cycles per second,
and a band pass of twice this quantity, or 1,530
cycles per second is required. Because fo, is commonly 800 cycles per second, this frequency shift
is important in determining the width of the band
pass of the sonar receiver. Circuits may be used
to eliminate this shift when it exceeds the band
pass of the receiver. One such circuit is called
own doppler nullifier and the other, target doppler
nullifier. These circuits will be discussed later.
APPLICATION TO ECHO RANGING
In echo ranging the operator does not hear the
outgoing ping, because the equipment is on send
and the receiver is blocked. Therefore, he cannot
compare the frequency of the returning echo with
that of the outgoing ping. However, he can compare the frequency of the echo with that of the
57
reverberation heard immediately after the ping is
emitted. This comparison has an important
effect. The difference between the reverberation
and echo frequency depends only on the target's
absolute motion through the water and its direction
relative to the sound beam. It is independent of
own ship's motion.
For example, suppose a ship is moving with its
sound beam directed dead ahead and with a velocity, V1, which is also the range rate, dR, if
the echo is from stationary objects (scatterers).
Just as with an echo from a moving target, the
relative motion between the source and the scatterers causes the reverberation frequency to increase. From equation (3-7), the reverberation
frequency after heterodyning is
fR=Fo+(2FoV1)/v (3-10)
If a submarine is approaching the echo-ranging
ship with a speed V2, the relative speed or range
rate is
V=dR=V1+V2 (3-11)
and from equation (3-7), the audio frequency of
the echo is
fE=fo + (2FoV1)/v + (2FoV2)/v cps. (3-12)
A comparison of equations (3-10) and (3-12)
shows that the audio frequency of the echo exceeds
that of the reverberation by
an expression that does not contain V1, the speed
of the sonar vessel.
If Fo, is 24 kilocycles,
Δf=17V2 cps; (3-14)
thus, for an approaching 20-knot submarine, the
frequency of the echo is 340 cps above the reverberation frequency. The quantity Δf is
known as the target doppler. Because operationally it is much more important than the absolute
doppler shift, it is frequently called simply
Doppler. It is "up-doppler" if the submarine is
moving toward the echo-ranging ship and "down-doppler" if it is moving away from the echo-ranging ship. Another useful characteristic of
target doppler is that it is proportional to the
speed of the target. Hence it can give information concerning the motion of the target. A
trained operator can estimate also the probable
aspect of the target with considerable accuracy
from the change in target doppler.
In the foregoing example, it s assumed that the
course of the target is directly toward (or away
from) the echo-ranging gear. t may be shown
that, in general, V2 is not the actual speed of the
target, but is its range rate relative to a stationary
point, P. This point, P, momentarily coincides
with the sonar projector but must be considered
stationary even though the sonar is moving.
The importance of target doppler in echo ranging
is immediately evident. It is a common experience
that a difference in pitch between two tones is a
great aid in hearing them; and even a very weak
tone can often be distinguished from others if its
pitch differs markedly. Thus target doppler is a
great aid in detecting echoes against a reverberation background but not against noise. The
ability of the operator to estimate the difference
in frequency between reverberation and echo
depends on the ping length.
Many "false" echoes are received from floating
debris, kelp, and unknown causes. These echoes
do not show the effect of target doppler. Thus a
final important application of target doppler is
in the identification problem.
Ear in Underwater Detection
LISTENING
Detection of underwater objects by listening
for the sounds they emit is known as listening.
Sounds made in the sea are easily detected by the
use of listening equipment. Listening, the oldest
method of detection, was used in World War I in
a very crude, but nevertheless effective, form.
The success of detection by listening is primarily
dependent on the ability of the operator to hear
and properly evaluate these sounds delivered by
the listening equipment.
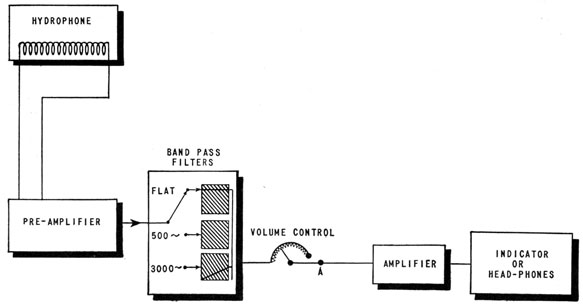
Any listening system must consist of (1) a hydrophone, (2) an electronic receiver, (3) a bearing
indicator, and (4) a speaker or headphones. The
sound-listening problem for the operator consists
primarily of learning to distinguish between (1)
58
sounds emitted by another ship's machinery
through the hull and from the propeller and (2)
the multitude of other sounds that exist in the
ocean.
There is always the problem of background
noise, which may make the sounds to be detected
unrecognizable. As pointed out earlier, the
characteristics of the ear enter into this problem.
During World War II many persons were found to
have hearing that was defective for sonar work.
Echo ranging and the listening problem differ
materially in several ways.
In echo ranging, the searching vessel projects a
sound signal into the water intentionally with the
expectation that the sound will strike a target and
that enough of the energy will be returned by the
target to the transducer to activate the receiver so
that the operator can recognize the echo. The
primary source of the sound is in the searching
vessel; the target is only a secondary source. The
transmission of the sound is a two-way process.
In listening, on the other hand, the sound signal
is emitted by the target itself, which therefore is
the primary source. Listening is hence a one-way
process.
This fact suggests that losses by transmission
should be smaller in the case of listening, and that
detection should be possible at longer ranges by
listening than by echo ranging, provided that the
sound output of the target is comparable to that
of the standard echo-ranging transducer. however, the noise output of most targets is less than
the output of a standard transducer. Even the
noisiest type of ship, a large battleship moving at
high speed, has an over-all output of sound of
about the same level as a standard transducer.
Furthermore the sound from a transducer is a pure
tone, because the echo has frequencies that are restricted to a band of about 200 cycles. On the
other hand, the sound from a battleship has components of a wide range of frequencies, and hence
is more easily masked by the background noise.
Nevertheless, conditions are frequently such
that ships are detected by listening at ranges of
10,000 yards and more, whereas echo ranging is
rarely effective beyond 3,000 yards. Echo ranging
enables the range and bearing of the target to be
determined accurately; listening gives the bearing
quite accurately, but provides little or no information on the range except in specialized equipment.
Listening is used chiefly by submarines. A surface vessel produces considerable noise, and this
noise interferes with the detection of the sounds of
other ships-especially the low sounds of submarines. On the other hand, this difference in the
noise output enables a submarine to detect the
presence of a surface vessel rather easily. An anti-submarine vessel, moreover, will generally not use
evasive tactics. Therefore it will not hesitate to
emit a powerful signal into the water, and thus
gain the advantages of echo ranging; whereas a
submarine will hesitate to reveal its presence by
echo ranging except in the last stages of an attack.
In order for listening to be a tactical aid, the
sound operator by use of his ear must be able:
1. To distinguish the sound emitted by the
target from the usual background noise.
2. To distinguish between the various kinds of
ship sounds with a view to possible identification of the type of vessel emitting them
and to obtaining information on the ship's
operating conditions.
3. After detecting and perhaps partially identifying a target, to obtain information concerning its approximate location and motion while it is still at comparatively long
range.
These considerations suggest the value and purpose of the investigation of ship and submarine
sounds. Such information will aid in the problem
of the control or possible elimination of revealing
noises. The basic principle in this problem is the
same as that underlying visual camouflage-to
render the target inconspicuous by making it resemble its background. Thus the sounds that are
unintentionally and unavoidably emitted should,
in the ideal case, have spectra that are very similar
to that of the background noise.
Another application is in the design and operation of acoustic mines and in the prediction of
their actuating ranges. This application, as well
as the defense against mines of this type, requires
a knowledge of the sound emitted by the vessels
against which they are to be used.
BACKGROUND NOISE
There are two principal sources of background
noise-airborne noise and amplified noise. When
using listening equipment, the operator depends
almost entirely on his ears, unaided by any form
59
of recorder or other apparatus. Occasionally a decibel meter or "magic eye"
is available for
supplementary quantitative information. His task is reduced to detecting
and recognizing a
wanted signal against the background of all the other sounds that impinge
on his ear. These
sounds are many and complex.
In the discrimination process, the operator distinguishes between wanted
sounds of the signal
from the target, and the unwanted sounds that are picked up or generated by
the receiver as well
as airborne sounds from his surroundings.
Airborne sounds often may be a limiting factor. Listening in an airplane
for the signals from a
sonobuoy sometimes is limited by this type of noise, which often is
referred to as "local noise"
or "room noise." The signal can be made more perceptible by increasing the
amplification of the
receiver; for in this case the airborne noise is not amplified and the
signal-to-noise ratio is
increased.
The desired signal is but one of the many sounds that are amplified and
heard by the operator.
These sounds originate in the sea and in the listening vessel itself, and
they constitute a masking
background for the signal. Increasing the gain of the receiver in this case
does not help, for the
background noise also is amplified with the signal. Noises that are created
in the receiver itself
also are amplified and, mask the desired signal, the same as those sounds
that are picked up by
the hydrophone.
The sources of the circuit noise are (1) thermal agitation of electrons in
the tuned input
circuit, (2) tube noise, (3) hum due to man-made disturbances, and (4)
vibration of tube
elements resulting in "microphonics."
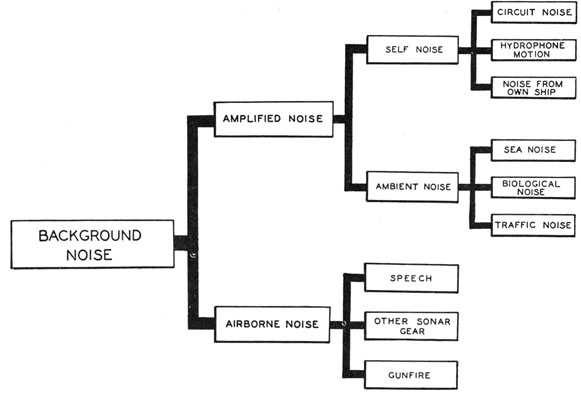
Figure 3-3 shows the complete classification of background noise. This
figure shows that
self-noises are (1) circuit noise, (2) hydrophone motion, and (3) noise
from own ship such as
vibration and turbulence caused by the ship's motion.
The other important sources of background noise are classified as ambient
noise. Ambient noises
are (1) sea noise, due principally to the
Figure 3-3. -Classification of background noise.
60
TABLE 5. -Over-all Levels of Amplified Noise (0.1 to 10 kc)
Types of noises
Decibels
Self-noise:
Circuit noise
-30 to 0
Submarine self-noise
0 to 20
Surface vessel self-noise (DD or DE) 10 to 25 knots
5 to 40
Ambient noise:
Sea noise:
Deep sea
-5 to 6
Near surface
-17 to 9
Biological noise:
Snapping shrimp
5 to 7.5
Croakers
36 (max.)
Porpoises
40 (max.)
Evening noise
8.5 (max.)
Traffic noise (includes sea noise)
0 to 22
wave motion at the surface of the water; (2) biological noise, caused by
many species of marine
life; and (3) traffic noise, which exists when many ships operate at the
same time, such as in a
harbor. The noise of fish and marine life is not always undesirable but in
the detection of ships
or submarines is usually a source of trouble. Because this type of noise is
rather peculiar, it
will be discussed in some detail.
Table 5 is a summary of the average values of background noise of all
kinds. This table, which
gives some interesting information regarding the intensity of noise made by
fish, will be
referred to from time to time.
SOUNDS PRODUCED BY OBJECTS IN THE SEA
Biological Noise
Surprisingly large numbers of species of marine life produce sounds of
various sorts. They are
mostly crustaceans and vertebrates. Biological noise is an important factor
in limiting listening
ranges in shallow water only in tropical and subtropical regions. To
discuss the complicated
subjects conveniently, it is customary to group the various sounds from
marine life into three
categories, which in the order of their importance from an operator's
viewpoint are (1)
shrimp noise, (2) periodic fish choruses or croaker noise, and (3)
miscellaneous biological
noise.
Early in World War II it was observed that as a listener approached shallow
water, the ordinary
ambient noise was sometimes replaced by sounds resembling the sizzle of
frying fat. As he came
closer to the shore, he noticed that the sound approximated the crackle of
burning twigs or the
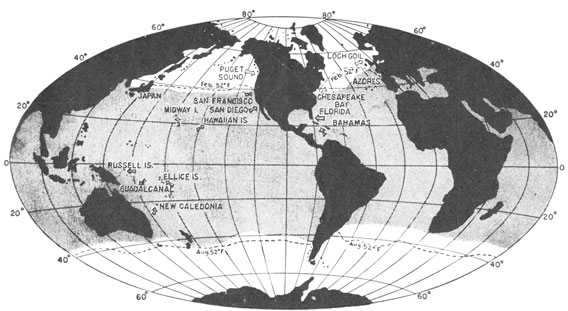
Figure 3-4. -Distribution o snapping shrimp.
239276°-5-5
61
crashes of static noise heard in a radio receiver.
This noise was encountered only in tropical and
subtropical regions, and was more common over
boulder-strewn or cobble-strewn bottoms. It was
sometimes confused with noise due to surf. Investigation discovered the source of this noise to
be colonies of certain species of snapping shrimp
(not to be confused with the ordinary edible
species) that close their pincers with a loud audible
click, similar to that caused by snapping a fingernail. The rate at which a single shrimp produces
clicks and the reason for this activity are not
known. The combined activity of hundreds of
thousands of shrimp is required to produce the
observed sizzle.
The chief habitats of these shrimp are in coral
formations and on rocky sea bottoms where the
water is less than 30 fathoms deep. Few are
found on mud or sand bottoms. The map in
figure 3-4 shows that they are widespread throughout tropical and subtropical regions of the world.
In this figure, shaded areas show regions where
shrimp occur when water depth and bottom are
favorable.
Shrimp noise is a serious masking noise in
listening, both because of its intensity and because
of its spectral distribution. Although it has a
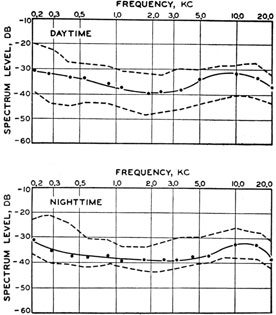
Figure 3-5 -Spectra of shrimp noise for daytime and nighttime.
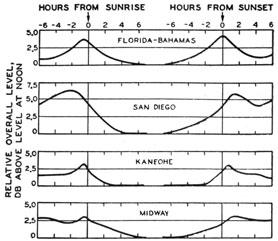
Figure 3-6 -Diurnal variation of shrimp noise, over-all level
at various locations.
measured frequency range of from 1.5 to 45
kilocycles the main components lie between 1.5
and 20 kilocycles. The spectrum level at 10
kilocycles may be of the order of -39 to -29 db,
as can be seen from figure 3-5. In this figure the
dots indicate average values; the dotted curves
show the spread of the spectrum levels. It is
evident that shrimp noise is a serious complication
in both sonic and supersonic listening.
Shrimp noise is remarkably constant throughout
the year. There is a small diurnal variation-the
noise is from 2 to 6 db higher at night than in
daytime, small maxima occurring about 1 hour
before sunrise and about 1 hour after sunset.
(See figure 3-6.)
The chief noise makers among fish are certain
species of croakers and drumfish, which are common, especially on the Atlantic coast. An individual croaker emits sounds resembling 4 to 7
rapid blows on a hollow log.
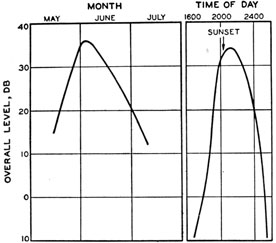
At certain periods of the year large schools of
croakers infest certain localities. In the Chesapeake Bay the croaker season extends from May
to July. During this season there is an evening
chorus of croaker noise lasting several hours, with
a peak just after sundown. Over-all levels of
croaker noise showing seasonal and diurnal variation are shown in figure 3-7.
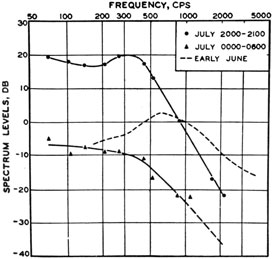
The spectrum levels of a sample of croaker
noise are shown in figure 3-8. The solid curves
show the difference in average level between early
evening and the period after midnight during July.
62
Figure 3-7 -Seasonal and diurnal variation of over-all levels
of croaker noise.
The dotted curve is the average spectrum for early
June. When it comes, croaker noise may completely mask desired signals, for the frequency
range of croaker noise lies almost entirely below
1 kc, the region where the most prominent components of ship sound occur.
In and near busy harbors the ordinary sea noise
and biological noises are overlaid with the sounds
associated with the movements of ships, especially
small high-speed craft, and by the noise of industrial operations on the beach. Listening in harbors
thus becomes extremely difficult; hence installations
Figure 3-8 -Spectra of croaker noise.
off the harbor entrance have been devised to
ensure protection of harbors against sneak attacks
by enemy submarines.
Traffic noise is essentially variable, but a certain
periodicity can be expected. Measurements made
in New York Harbor and its approaches are shown
in figure 3-9. Curve A shows the spectrum level
of the noise in the harbor in the daytime, and
curve B, the average levels measured in upper
Long Island Sound near the ship lanes. Curve B
is about 9 db below the harbor level at all frequencies. For comparison, the curve of sea noise
for sea state 2 is included as curve C. In the
region of sonic frequencies the harbor noise is from
10 to 18 db above this level. Over-all sound levels
(0.1 to 10 kc) for the noise in the harbor itself is
about 16 db, compared with 6 db in the harbor
approaches and 0 db for water noise with sea state 2.
Figure 3-9 -Spectra of traffic noise in New York Harbor and
its approaches during the daytime.
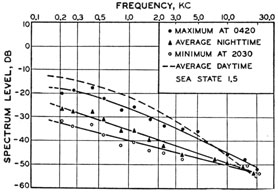
Nighttime levels of ambient noise in the approaches to New York Harbor are shown in figure
3-10, with a curve showing average daytime levels
added for comparison.
Submarines
From the standpoint of antisubmarine operations, a knowledge of the sound output of submarines is needed for the prediction of maximum
listening ranges. The design of listening gear, in
particular the choice between sonic and ultrasonic
devices, depends on the spectrum of the sound
to be detected.
From the standpoint of submarine operations,
it is important to know the relative sound output
of various submarine maneuvers, so that evasive
action is not nullified by excessive detectable
63
Figure 3-10. -Same as figure 3-9 but for nighttime.
sound. The problem of noise control, and the
design of propellers, engines, and auxiliaries, all
demand measurements of sound output.
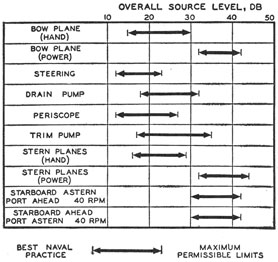
The machinery of the submarine is extremely
diversified and complicated. The submarine has
more than 50 auxiliaries, all of which are potential
sound sources. Figure 3-11 lists a few of these
sources, shows the source levels that have been
proposed as best naval practice, and gives the
maximum permissible limits.
In general, these sounds have a continuous
spectrum, with a maximum at low frequencies.
Sometimes, however, the machinery produces a
Figure 3-11 -Suggested limits of over-all sound level of several
auxiliaries on submarines, and the levels representing best
naval practice.
strong line spectrum that is superimposed on the
continuous spectrum.
Propeller sounds are of two general kinds- (1) singing, due to vibrations of the propeller
blades, and (2) cavitation. Cavitation sounds are
the most important of all submarine sounds.
Vibrations of the propeller blades may be due to
faulty design or manufacture and are generally
not difficult to eliminate.
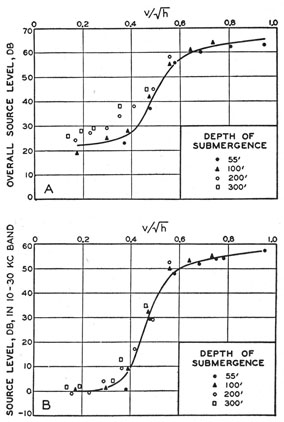
Figure 3-12 -Dependence of over-all source levels of submarine sounds on depths of submergence h (feet) and speed
V (knots). A, 0.1-kc to 10-kc; B, 10-kc to 30-kc.
Cavitation results when the propellers turn so
rapidly that the water does not close in behind
the blades. Thus, a stream of bubbles resembling
those in a boiling kettle is formed. These bubbles
may be caused by reduced pressures on the backs
of the propeller blades or by vortices at the tips
of the propeller blades.
64
The steep rise between the value of 0.4 and the
value of 0.6 for V/h½ is due to cavitation (figure
3-12). The smooth curve is drawn on the assumption that the speed at which cavitation occurs is
inversely proportional to the square root of the
hydrostatic pressure. Figure 3-12, A, plots the
levels measured in the 0.1-kc to 10-kc bandwidth;
figure 3-12, B, the levels in the 10-kc to 30-kc
band. Acoustically, tip cavitation appears to be
much more important than blade cavitation.
This condition may exist because blade cavitation
has a more serious effect on propeller thrust and
is usually prevented by the designer of the ship.
Besides these two main sources of submarine
sounds, there are some minor sources, such as
splashing of water at the bow and in the wake
when the submarine is at the surface; when
submerged, the fittings of the vessel, such as
handrails, may be set into vibration by the
turbulent flow of water past them. These sounds
are considered to be of small significance compared
with those due to cavitation.
The activities of the crew are a source of
incidental sound. It is interesting that, according
to some British measurements, over-all source
levels of from 45 to 50 db may be produced by
dropping a wrench or by the use of the engine-room
telegraph-levels comparable to those produced by
the submarine itself under conditions of evasive
operations. The transitory character of such
sounds makes them comparatively unimportant,
except when the submarine is evading detection
by an alert enemy.
The sound output of a submarine varies widely
with the size and type of submarine. For a given
submarine it varies with speed and operating
conditions. If the submarine is submerged, its
sound output at a given speed decreases as the
depth increases.
The over-all source level may range from about
40 db under evasive conditions to more than 75 db
at top speeds. An average based on a large number
of measurements gives the following values:
(1) Running submerged at 6 knots, or on the
surface at 12 knots, the over-all source level is
about 72 db; (2) at top surface speeds, the
over-all source level is about 77 db.
The dependence of the over-all source level on
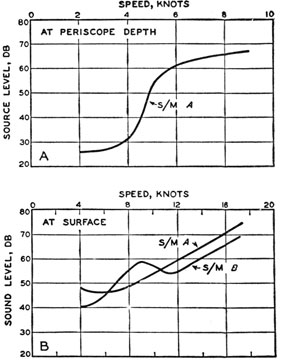
speed is shown for two submarines in figure 3-13.
Figure 3-13 -Over-all source levels of submarine sounds.
A, Submerged variation with speed; B, two submarines,
surface operation, illustrating the variability between ships.
In figure 3-13, A, the over-all source level is
plotted against the ship speed for a submerged
submarine, and in figure 3-13, B, for two submarines operating at the surface.
The variability of source level from ship to ship
is indicated by the curve of submarine B in figure
3-13, B. The values of source levels of various
submarines may vary by as much as 15 db under
identical operating conditions.
The curve pertaining to operation at periscope
depth is typical of ship sounds in general. At very
low speeds the source level is quite low. At a
certain critical speed-in this case 4 knots-the
sound output increases very rapidly with speed,
so that an increase of 2 knots is accompanied by
an increase in the source level of 30 db. If the
speed is increased beyond 6 knots, the curve
levels off.
This abrupt increase in the sound output at the
critical speed is due to cavitation, which is related
to many factors but chiefly to the shaft rate or
speed and to the hydrostatic pressure. If other
65
factors remain constant, the speed at which cavitation occurs is inversely proportional to the square
root of the static pressure. Hence the sound
output at a given speed is less when the submarine
submerges to greater depths. This fact is shown
by figure 3-12, in which over-all source levels are
plotted against V/h½ where V is the speed in knots
and h is the total hydrostatic pressure head. The
value of h is calculated from h=33+d, where d
is the depth in feet and 33 feet is the head of sea
water equivalent to 1 atmosphere. The experimental points fit the theoretical curves fairly well.
The speed required for cavitation to set in is,
in general, higher for submarines of new design
because of a persistent effort to decrease the sound
output of American submarines. It has been
decreased, on the average by about 20 db; however,
a few submarines still produce prominent and
undesirable single-frequency tones below 1,000
cycles per second. There is considerable evidence
that these sounds originate almost entirely in the
reduction gears.
The relation between sound level and speed of
a submarine is quite different for surface operation.
Figure 3-13, B, shows that the increase in source
level of submarine A is gradual, and does not show
the abrupt rise due to cavitation that is observed
with submerged operation. The higher levels
associated with surface operation are attributed to
the Diesel engines used for operating on the surface; the electric drive is considerably more quiet.
The hump shown in the curve for submarine B,
figure 3-13, B, is caused by a singing propeller.
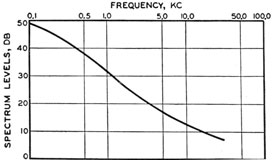
Figure 3-14 gives the spectrum of a submarine
running at 6 knots at periscope depth or at 12
Figure 3-14. -Average spectrum of a submarine running at 6 knots at periscope depth or at 12 knots on the surface.
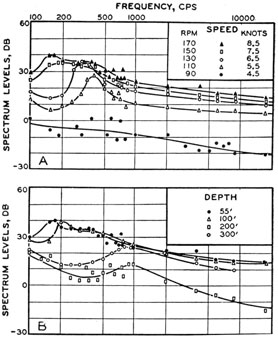
Figure 3-15 -Spectra of individual submarines. A, The variation of spectra with speed of submerged submarine; B, effect of increasing depth on the spectra.
knots on the surface. These values are the average
of a large number of measurements. It must be
borne in mind that there is a great spread in
individual measurements, and thus the sounds
from a given submarine may deviate decidedly
from the values in the figure.
Figure 3-14 shows that the intensity of submarine sounds decreases rapidly with the frequency;
the drop in level is about 6 db per octave on
the average. In other words, the spectrum level
is about 20 db higher at 100 cycles per second
than at 1,000 cycles per second and this same
proportionate variation continues at least until
30 kilocycles. As a result, the over-all level is
largely determined by the lower frequencies.
If the threshold of listening gear were independent of frequency, sounds with such a spectrum
would be much more readily detected with sonic
than with ultrasonic devices. However, the threshold also decreases with increasing frequency,
especially for gear mounted on a moving surface
vessel. Until recently this factor has tended to
nullify the advantage of sonic listening. On
66
sailing vessels, sonic listening retains its advantage,
especially if the auxiliaries can be periodically
shut down for listening. An effective antisubmarine watch can thus be maintained from such
vessels. The same is true of bottom-mounted
hydrophones and sonobuoys, both of which use
the sonic band.
Sound-level spectra of individual submarines are
shown in figure 3-15 and figure 3-16 for various
operating conditions. Figure 3-15, A, shows the
effect of increasing speed on the sound-level spectrum. A characteristic feature of these curves is
a peak at low frequencies, and a tendency for this
peak to occur at lower frequencies as the speed increases. This behavior is ascribed to cavitation
effects. It is thought that higher propeller speeds
produce progressively larger bubbles. The resonant frequency of a bubble is inversely related to
its diameter, and thus an increase in speed results
in the production of sound of a lower frequency.
The exact position of these peaks also varies
from submarine to submarine. Consequently
they do not show on the average curve of figure
3-14. Even the peaks of these submarines lie well
below the average curve for frequencies of less than
1 kc.
Figure 3-15, B, shows the effect of increasing
depth on the sound-level spectrum. The peaks
tend to shift toward higher frequencies with increasing depths. The increase in hydrostatic
pressure with depth probably reduces the size of
the cavities formed at a given speed and thus results in a higher resonant frequency.
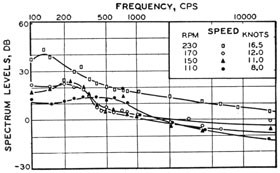
Very little is known concerning the location of
the particular point, or points, on the ship that can
Figure 3-16 -Variation of spectra of individual submarines
with speed in surface operations.
be considered as the effective source of the radiated
sound. There is reason to believe that at periscope
depth the engine room is the principal source of
sounds at very low speeds, whereas at speeds above
3 knots the propeller is chiefly responsible. however, even at high speeds the engine room may
contribute materially to the sound at frequencies
below 150 cycles per second. During surface operations the propeller and wake are probably the
principal sources of sound at practically all speeds
with electric drive. With Diesel drive the engine
room is the main source at low speeds and a material contributor at all speeds.
The sounds from submarines are radiated in such
a way as to produce approximately a uniform
sound field at a distance of several ship lengths
from the source. Some observers report a slight
decrease in the sound level in the region within 10°
or 20° on either bow; at 200 yards this decrease is
from 2 to 4 db. A similar shadow astern of the
ship has been reported. This shadow is ascribed
to the wake.
Surface Ships
The sounds emitted by surface vessels may provide considerable information to an experienced
sound operator aboard a submarine. Various
forms of underwater mines are detonated by a
ship's sound. Ship sounds vary greatly in intensity and spectrum from ship to ship and from one
class of ship to another. For a given ship sound
intensity and spectrum vary with speed.
From the viewpoint of defense, every ship that
is likely to enter water harboring hostile submarines obviously would benefit by an analysis
of its own sound output. Such an analysis would
disclose the existence of any revealing single-frequency components. These undesirable components are due to causes that can be remedied
easily. The analysis also would make possible
more accurate estimates of the range at which a
ship is apt to be detected by an enemy submarine.
The extreme values of observed over-all source
levels range from about 50 db for launches and
small auxiliary craft at low speeds to 110 db for
battleships at 20 knots. The 110-db value is
approximately the source level of a standard
sonar projector. The average over-all source
levels of submarines range from about 30 to about
75 db.
67
Figure 3-17 -Spectra of surface ships.
Besides being affected by the speed of the vessel,
the over-all source level is a function also of the
load or displacement of the ship.
The sources of ship sounds are extremely
diversified, and a given source may change its
sound output with ship speed. Hence ship sounds
are variable and complex and are distributed
through the whole range of frequencies. As with
submarines, the chief sources are the screws,
where cavitation produces the sound, and the
hull, which transmits the vibrations of the
machinery and engines.
Single-frequency components due to propeller
singing or to vibrations of the propulsion
machinery are common. Ordinarily such sounds
occur below 1 kilocycle, but sometimes these
single-frequency components are encountered well
above this frequency.
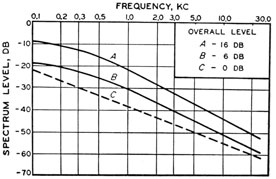
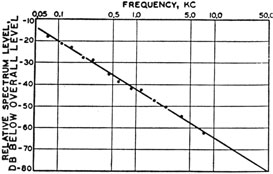
Figure 3-17 shows the average spectrum-frequency distribution of sounds from a large
number of surface ships. The data on which this
figure is based were the average measurements
made on 52 ships comprising 12 different types of
warships and commercial vessels. The ordinates
on the graph are the values of relative spectrum
levels-that is, of the spectrum level minus the
over-all level (0.1-kc to 10-kc). These differences
are averaged for all types of ships in order to
obtain the graphs. Because the total spread of
the measurements on the individual ships was
considerable, due allowance for this spread must
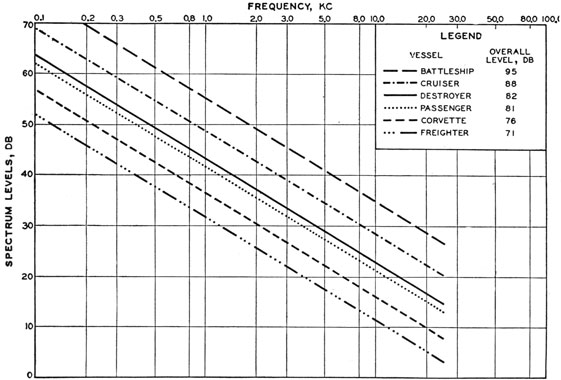
Figure 3-18. -Average spectrum levels for six different classes of ships.
68
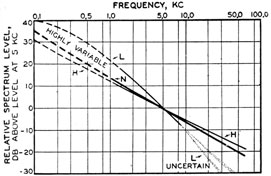
Figure 3-19 -Effect of varying speed on spectral distribution.
be made when using data from this graph and the
following graphs.
The level of the sound decreases with increasing
frequency at a rate of 7 db per octave. This
relation is similar to that shown in figure 3-14
for submarines. Spectra of the different ships
vary in average slope from about 5.5 to about 8.6
db per octave. Figure 3-18 shows average spectrum levels for six different classes of ships at
normal cruising speeds. The average over-all
levels also are indicated.
Figure 3-19 illustrates the effect of varying
speed on a ship's spectral distribution. Curve L
represents the average spectrum at low speeds,
curve H that at high speeds, and curve N that at
normal cruising speeds. At very low speeds the
chief source of sound is the machinery, and all the
machinery contributes materially. Much of the
sound from this source is concentrated at the lower
frequencies; therefore in this region the spectrum
is highly variable, as was previously noted with
submarines.
The variability of the spectra in the lower frequency region may be ascribed again to cavitation,
which is the chief source of ship sounds at all but
the lowest speeds. The sound due to cavitation
has a continuous spectrum, whereas machinery
sound generally is more likely to consist of many
discrete components closely spaced. Above approximately 1 or 2 kc the spectral slope of cavitation sound is very nearly -6 db per octave; but
in the region of lower frequencies there is usually
a peak (figure 3-15). The frequency at which this
peak occurs depends on various factors related to
the type and .size of ship and its speed, and thus
may provide some information tending toward
identification of the vessel.
At high speeds cavitation may introduce components in the ultrasonic region, as shown by
curve H in figure 3-19.
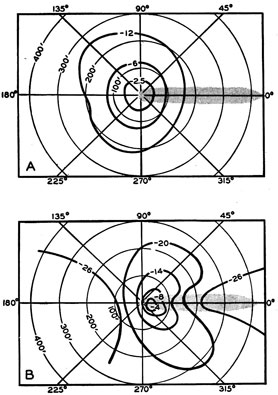
The sound emitted by ships has very little
directivity, particularly in the sonic region of
frequencies. Average directivity patterns for
15 freighters for the low frequencies (200 to 400
cycles per second) are illustrated in figure 3-20,
where sound levels are exhibited as contours-lines
joining points of equal intensity. The levels were
measured with a bottom-mounted hydrophone.
Contours are somewhat difficult to reconcile
with the fact that many ships have two dominant
sources of sound, one at the engine room and the
other at the screws. In large destroyers these
two sources are of equal level at about 12 knots.
At 8 knots the engine room is the dominant source,
whereas at 16 knots the screws are the dominant
Figure 3-20 -Contours showing the average directivity of ship
sounds. A, Average patterns for 15 freighters for low frequencies (200-400 cycles per second); B, contours of sound
levels for a typical freighter at 8 knots. The outline of the
ship is indicated by the shaded area.
69
source. In Liberty ships, however, the two
sources are of about equal level at all speeds. The
dominance of the propellers as the source of sound
for the 15 ships shown in figure 3-20, A, possibly
indicates that Liberty ships are not typical of all
freighters.
If the source of sound from a ship is concentrated
at the screws or over a small part of its hull, the
audible sound is independent of direction except
for the shadow effect of the hull and wake. This
effect is illustrated graphically in figure 3-20, B,
which shows the contours of pressure levels for
a typical freighter cruising at 8 knots. The outline of the ship is shown by the shaded area. The
shadow and screening effects are highly variable
from ship to ship. These variations and the
variable distribution of the sound sources make it
difficult to generalize about the sound distribution.
It is probable that for large ships the sound-pressure level 400 to 500 feet ahead or astern of the
main source of sound is 5 to 10 db below the level
at the same distance abeam.
Time Patterns and Propeller Beats
RHYTHMS AND OTHER TIME PATTERNS
The necessary prerequisite for the detection of
a ship or submarine is that its sound have sufficient
intensity at the hydrophone to be heard above the
background noise. Because the level of background noise usually varies in an irregular manner,
a rhythmic sound having a periodic pattern of
beats, may be more readily recognized than a
nonrhythmic one.
Moreover, intensity alone conveys no information other than that something in the neighborhood is making a noise. Additional information
about the source is obtained from the spectrum
(high or low pitch) and from any rhythm that is
inherent in the sound.
The propeller sounds of a large ship, although
produced by cavitation, usually pulsate periodically. In some ships, the beat may be unaccented
and occur once per propeller revolution (shaft
frequency). Other propeller sounds pulsate several times per revolution; a three-blade propeller
gives 3, and a four-blade, 4, beats per revolution
(blade frequency). If the beat is unaccented, it
is difficult to determine which frequency is involved. However, one blade is often noisier than
the others, resulting in an accent repeated at shaft
frequency. In favorable cases, therefore, both
the number of blades and the propeller rpm can
be determined. These items partially identify the
class of ships, and certainly differentiate its sound
from various intermittent background noises.
Perception of Time Patterns
The manner in which fluctuations in sound level
are heard depends on their rate or frequency.
Very slow changes in level are not perceived unless
they are relatively large; they are often called
fading. Rhythms are most easily heard and
counted when the beats occur two or three times
a second. At high rates, counting becomes difficult; with practice, it can be done by counting
every third or fourth beat.
When the frequency becomes greater than about
15 or 20 cycles per second, the individual beats
are no longer heard. The rhythm is then heard
as a "flutter" or "tremolo". Frequencies much
above 100 cycles per second are not recognized as
periodic, but as a pitch that is inherent in the
sound.
SINGLE-FREQUENCY COMPONENTS
Audibility
Previous discussions in this chapter have pointed
out that ship sounds in general have continuous
spectra-that is, (1) the emitted sound energy
is distributed over a wide range of frequencies,
and (2) on the average, the distribution of the
energy over the frequency range follows a fairly
simple pattern-a decrease in the sound level of
about 6 db per octave increase in frequency.
Mention has been made, however, of the occurrence in ship sounds of relatively pure tones of
audible frequency. On a spectrum plot an absolutely pure tone would be one-dimensional having
sound level but no frequency width. A spectrum
composed predominantly of such discrete components would be a line spectrum. Actually the
so-called single-frequency components comprise
a relatively narrow band of frequencies; but if
the width of this band is smaller than the width of
the band that can be resolved by the ear, the
single-frequency components will have a definite
70
pitch. It is in this sense that the terms "single-frequency component" and "pure tone" are used.
The ear very readily detects pure tones against
a background of complex noise. This detection is
possible because the ear is a very efficient analyzer
of comparatively high selectivity, and because a
pure tone has a distinctive quality that contrasts
strongly with random noise, which has no definite
pitch. These characteristics make it possible for
the ear to detect a pure tone in the audible region
even when its sound level is considerably lower
(sometimes as much as 20 db) than the over-all
level of the background noise.
Tests have shown a pure tone can be heard when
its level is at least equal to the level of the background noise in a band of a certain width at the
frequency of the tone. The width of the band depends on the frequency. These critical bands are
from 30 to 50 cycles per second wide for tones
of between 100 and 1,000 cycles per second. This
fact is an indication of the great effectiveness of
the ear in discriminating against random noise.
Time Patterns
Pronounced rhythmic time patterns sometimes
occur in single-frequency components originating
in propeller vibrations. Also, many single-frequency components have their source in reduction
gears.
The extreme audibility of single-frequency
components, as compared to sounds of continuous
spectrum, introduces complications in the techniques of sound measurement. For example,
suppose the over-all level of a moored submarine
with its motors secured is measured. It has a
continuous spectrum of certain over-all level.
The motor may produce a pure tone that increases
the audibility of the submarine's sound very
materially, but may scarcely affect the over-all
level.
Frequency Considerations in Listening
In the over-all problem of detection by listening,
two general classes of systems can be distinguished.
One class includes those systems with a listening
band that falls in the ultrasonic region and an
output that is made audible by a heterodyne
change of frequency. The other class has its
listening band in the audio frequencies and does
not need a heterodyne stage to make the output
perceptible.
SONIC LISTENING
Sonic listening depends on the sources of sonic
sounds. These sources are surface vessels, submarines, torpedoes, explosions of depth charges,
and the echo-ranging signals of other vessels.
Cavitation sounds have a comparatively continuous spectrum, the level of which falls off about
6 db per octave on the average. They are sufficiently uniform to make it possible to determine
the cavitation spectrum of a given class of ship
at a given speed by taking a single measurement
at some frequency-say 1 kc or 5 kc. Enough
measurements on cavitation sounds from various
sources have been made to enable the prediction
of their level for any class of ship at any speed
within about 5 db.
It is not so easy to predict the level of machinery sounds, which are the dominant source of
low-frequency sound (less than 1 kc) at low speeds.
These sounds have very complex and irregular
line spectra and differ widely among different
ships. They are heard as squeaks, rumbles,
groans, and whines.
The spectra of the various types of ambient
noise that are encountered in listening have been
discussed. Ambient noise is the limiting factor
when the listening hydrophone is stationary, provided the sea state is greater than 1 or 2. For a
sea state of less than 2, the over-all level of ambient
noise drops below 0 db and thus approaches the
over-all level of circuit noise, which ranges from
-30 to 0 db. In this case, the circuit noise may
be limiting. Shrimp noise is usually negligible at
lower sonic frequencies.
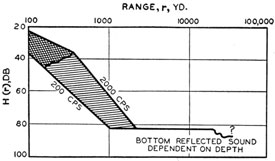
The data for transmission loss in the frequency
range of from 200 to 2,000 cycles per second can
be schematically summarized (figure 3-21).
At ranges less than a few hundred yards, the
transmission loss, H, is variable because of the
interference between direct and surface-reflected
sound. This condition is indicated by the double
hatching in the figure. Beyond this variable
region, the transmission loss increases rapidly out
to about 2,000 yards. The frequency is a determining factor in this region. The low frequencies
suffer a greater loss than the high frequencies.
71
Downward refraction in the upper layers causes
this loss to occur at shorter ranges. The single
hatching on figure 3-21 shows the region of the
rapidly increasing loss.
Beyond this region bottom-reflected sound is
dominant, and the transmission loss remains
constant out to about 20,000 yards. The magnitude of this loss and the range at which it begins
depend on the depth of water. A value of 80 to
85 db appears to be relatively independent of
thermal conditions but increases slightly with the
hydrophone depth. This value is also subject to
irregular fluctuations of considerable magnitude,
but they do not appear to bear any systematic
relation to the range.
At very long ranges the transmission loss must
again increase, but there is very little data to
indicate the rate of increase.
The fact that the transmission loss of bottom-reflected sound is nearly independent of range has
an important effect on the maximum ranges
obtained with sonic gear. If the available signal
output is between 60 and 80 db, the maximum
range is likely to be less than 1,000 yards and
unlikely to be greater than 2,000 yards. Contact
is not established until the target becomes audible
by way of direct sound. If the available signal
output is greater than 80 db, however, the bottom-reflected sound may become useful, and range may
suddenly increase to between 10,000 and 20,000
yards.
ULTRASONIC LISTENING
Ultrasonic sound is made audible by heterodyning, so that the loudspeaker of the listening
system emits audible sound. The general principles of recognition for heterodyned ultrasonic
Figure 3-21 -Transmission loss H(r) for sonic sound.
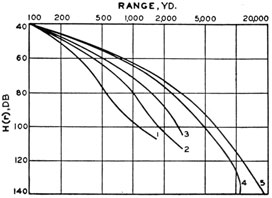
Figure 3-22 -Transmission loss H(r) at 24 kc for various thermal
conditions.
sound are thus identical with those applying to
audible sound. However, several quantitative
differences exist.
In the first place, ultrasonic receivers usually
have pass bands not more than 1 kc wide. The
spectrum of the heterodyne output may thus be
confined to the range of from 300 to 1,330 cycles
per second, as compared with a range of 10,000
cycles per second in sonic listening.
In the second place, a 1-kc band of one ultrasonic spectrum is very similar to a 1-kc band of
another. There are no single-frequency peaks,
and although most spectra slope 5 to 9 db per
octave, the change in spectrum level over a 1-kc
band is negligible for many purposes. This
principle applies to background noise as well as
to the sound output of ships.
Thus, there usually is no one frequency of the
heterodyned sound that is more audible than
another. There is no tonal quality to distinguish
the signal from the background.
In general, the recognition differential for ultrasonic listening is zero. The ultrasonic sound from
a ship's screw, however, is usually rhythmically
modulated in intensity. Recognition occurs when
the maximum level of a rhythmic signal is equal
to, or possibly a few decibels less than, the average
level of nonrhythmic background. The maximum
level of screw sounds is usually about 3 db above
the average level. Because most measurements
yield average values, they must be increased by
about 3 db in calculating the available signal.
This increase is sometimes loosely called a "recognition differential."
72
An exception to these statements occurs when
the target vessel is echo ranging. The pings are
heard as tonal pulses of sound which have a high
recognition differential, as well as a high source level.
These considerations introduce some simplification into the calculation of ranges. The spectra
of the signal and the background noise need not
be considered in detail; it is sufficient to state the
spectrum levels at the midpoint of the listening
band.
The situation with regard to background noise
is similar to that of sonic listening. That is, if
the listening vessel is quiet, ambient noise predominates; whereas if the listening vessel is noisy,
the noise of the listening vessel predominates. In
ultrasonic listening, however, when ambient noise
is limiting, shrimp crackle becomes important.
The ordinary levels of ultrasonic ambient noise
range from -78 to -53 db depending on sea
state. If shrimp are present, however, the
ambient noise levels may be -49 to -39 db.
When used at ultrasonic frequencies, listening
gear discriminates against ambient noise. A
directivity index, D, of -23 is common among
standard echo-ranging transducers.
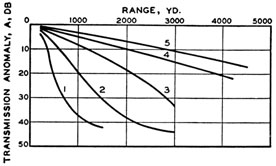
The graphs of figure 3-22 should be compared
with figure 3-21 to contrast the transmission loss
of the ultrasonic frequencies.
The curves in figure 3-22 are based on the
anomaly of figure 3-23, and the same numbering
is used. Because there is no horizontal portion of
Figure 3-23 -Average transmission anomaly under various
oceanographic conditions.
these curves (figure 3-22) the ultrasonic ranges
should show less variation than do the sonic
ranges. Because of this fact, also, there seems
less probability of achieving great improvement
in the performance of ultrasonic systems by a reduction in self-noise.
The values of the transmission anomaly in
figure 3-23 have been determined by experiment.
In this figure D2 is depth for which the change in
temperature is 0.3° F, which is the smallest temperature change that can be detected by the present bathythermograph. Note that D2 has the
following values:
Curve 1-0 ft<D2<5 ft.
Curve 2-5 ft<D2<20 ft.
Curve 3-20 ft<D2<40 ft.
Curve 4-40 ft<D2<80 ft.
Curve 5-80 ft<D2<300 ft.
Sonar Listening Systems
SONIC LISTENING SYSTEM
Many of the problems that affect underwater
detection by receiving and analyzing both sonic
and ultrasonic sound energy have been discussed
in this chapter. Block diagrams and a brief description of the function of the various components of both types of listening equipment will
now be given. The sonic listening equipment
consists of a hydrophone, training unit, receiver-amplifier, and headphones or speaker. This system is shown in figure 3-24.
Hydrophone
The hydrophone used in listening equipment is
primarily of the magnetostriction type. Some
equipments use the crystal type. The primary
purpose of the hydrophone is to convert sound
energy in the water into electric energy that can
be amplified and heard from the loudspeaker.
The hydrophone must have a directional characteristic. This directional characteristic is used
in two ways. First, it allows the operator to discriminate against unwanted sound, and, second,
it enables the operator to determine the direction
from which the desired sound is coming.
The discussion thus far applies to both sonic
and ultrasonic hydrophones. There is little
difference between them. The sonic hydrophone
must have larger dimensions than the ultrasonic
hydrophone for the same directivity index.
73
Training Unit
The method of training the hydrophone may be
either manual or power. The more modern
equipments use an electrically operated drive
called a servo-mechanism. This drive is usually
an amplidyne system. The operator can train
the hydrophone on any bearing relative to the
ship. A synchro repeater system is used to give
bearing indications to the operator in both relative and true bearings. The two functions of the
training device are therefore to allow the operator
to train the hydrophone and to provide him with
visual indication of the bearing to which the
hydrophone is trained. The training unit is the
same for both sonic and ultrasonic listening. In
some installations it is used for both.
Receiver-Amplifier
The receiver-amplifier is simply an audio
amplifier with wide-frequency response. The
electrical signals from the hydrophone enter the
receiver where they are amplified until their intensity is sufficient to drive a loudspeaker or
headphones, as the need may be. There is no
necessity for any frequency conversion because
the signals entering the receiver in sonic listening
are already in the audible frequency range-unlike
those entering the receiver in ultrasonic
listening in which heterodyning is necessary.
This frequency conversion is the principle difference between the sonic and ultrasonic systems.
It may be desirable under some conditions to
limit the frequency response of the receiver in
sonic listening. Band-pass filters are usually included for, this purpose. If the principal signal
desired by the operator were about 500 cycles per
second it would be possible to increase the signal-to-noise ratio by cutting down the band pass of
the receiver just enough to include this frequency.
Any noise falling outside the band pass of the
receiver would not be heard.
Headphones and Speaker
The choice of headphones or speaker is dictated by the airborne noise of the surroundings.
The purpose of these devices is to convert the
electric signals from the receiver into sound impulses that can be heard by the operator. The
cycle is completed by this conversion. In the
water the signal is first sound energy, and when it
falls on the hydrophone, electric impulses are
generated. These electric impulses are amplified
and reconverted into sound by loudspeakers or
headphones.
Figure 3-24. -Block diagram of a sonic listening equipment.
74
Figure 3-25 -Block diagram of the ultrasonic converter.
ULTRASONIC LISTENING SYSTEM
Ultrasonic listening equipment will be discussed by comparing it to sonic listening equipment. The ultrasonic hydrophone is the same as
the sonic hydrophone in most cases. A small
ultrasonic hydrophone, however, gives directivity
similar to that of a large sonic hydrophone. Thus
the directivity index of the same hydrophone used
for both sonic and ultrasonic listening is greater
for ultrasonic listening. An ultrasonic hydrophone, therefore, gives sharper bearing indication.
The training equipment of ultrasonic systems
is identical to that of sonic systems.
The principal difference in sonic and ultrasonic
listening is in the receiver-amplifier. When the
sound to be heard is in the ultrasonic frequency
range some method must be used to bring it into
the audible, or sonic range. Heterodyning in the
receiver accomplishes this change in frequency.
Note the signal path in the block diagram of the
ultrasonic converter shown in figure 3-25.
Usually there is a broad-band amplifier stage
at the receiver input. This stage is followed by
a filter system and an attenuator. The signal is
then fed into the first mixer, where it is mixed
with the output of a variable-frequency oscillator.
The tuning of this oscillator provides for the adjustment of the receiver to various frequency
inputs. The signal from the mixed stage is amplified through an intermediate-frequency amplifier similar to that of any superheterodyne radio
receiver. This intermediate frequency is usually
above the frequency of the ultrasonic signal and
is the sum of the ultrasonic signal and the output
of the oscillator. The intermediate frequency is
then fed into a second mixer where it beats with
a second oscillator to give an output in the
audible-frequency range. This converting system is in addition to the regular audio amplification of the receiver, which drives the speaker.