9-1. Stability data. Data on the stability of a ship are furnished by the Bureau of Ships. They will be found in the Booklet of Inclining Experiment Data and the Damage Control Book. This Chapter deals with the stability data that are represented in both publications.
The Booklet of Inclining Experiment Data contains the results of the inclining experiment. It is customary to incline one or two ships from each building yard that are representative of any one class; therefore, although a particular ship has not been inclined, applicable data from another ship of the class usually are available. The booklet will remain applicable to the ship until alterations involving major weight changes are made. The Bureau of Ships will then authorize the performance of another experiment.
9-2. Conditions of loading. Complete stability data are contained in the Booklet of Inclining Experiment Data for various conditions of loading. The following information is listed for all specified conditions:
1. Displacement.
2. Mean draft.
3. Trim
4. Amount and location of various consumable weights aboard.
5. Location of ship's center of gravity.
6. Free surface in ship's tanks.
9-3. As-inclined condition (Condition I). As indicated in Chapter V, the inclining experiment is conducted after the completion of the ship or after a major overhaul. The ship as inclined is seldom in an operating condition of loading. The data calculated for this as-inclined condition are of dubious value to personnel afloat and must be corrected by calculations to the standard conditions.
9-4. Standard loading conditions. The standard loading conditions as represented in the Booklet of Inclining Experiment Data are as follows:
Condition II-Light.
Condition IIA-Light, without permanent ballast (This condition is included only when ships
have permanent ballast).
Condition V-Normal load (As indicated in BuShips directives, L.S. (light service), minimum service, or optimum battle conditions usually are substituted for Condition V).
Condition VI-Full load.
Condition VII - Emergency load (Sometimes termed condition M (maximum load) ).
Other special conditions may be included as directed by BuShips. These include special low stability operating conditions which may develop, conditions of light load with water ballast, and other similar items.
9-5. Condition II - light condition. This condition assumes that the ship is complete in every respect, ready for sea, but without any load aboard. Absence of load implies that the ship contains no fuel oil, water, ammunition, stores, crew and effects, or water or oil in machinery. This condition is rarely if ever attained, and is not an operating condition. It is, however, the basic condition from which other conditions are calculated.
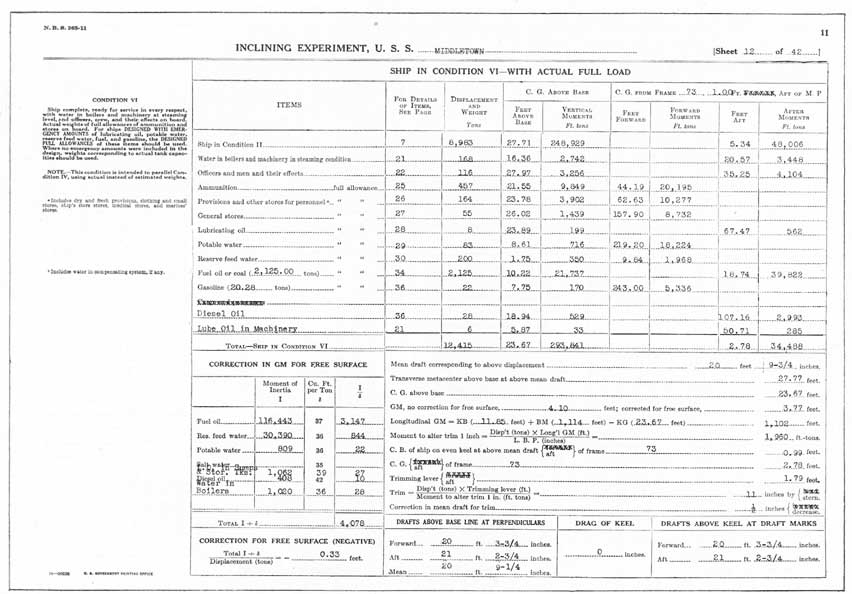
9-6. Other conditions of loading. Having obtained the displacement and the location of the center of gravity of the ship for Condition II, corresponding values may be computed for the other standard conditions of loading. The weights and vertical moments of all the consumables to go aboard are determined. Starting with the displacement and KG for Condition II, a new displacement, KG, and GM are calculated for the other conditions of loading. The GM thus obtained is corrected for the free surface assumed to exist in the ship's tanks. A typical page 11 (Booklet of Inclining Experiment Data) containing the data for Condition VI is shown as figure 9-2.
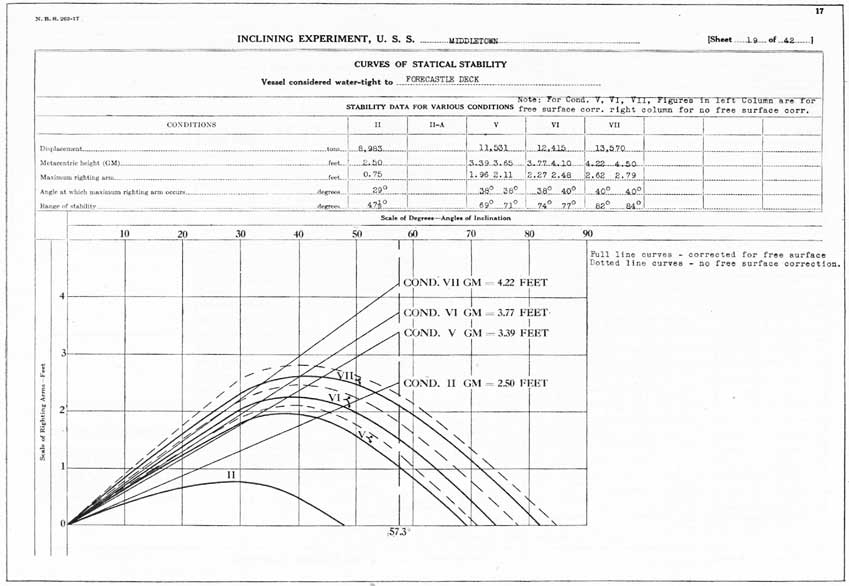
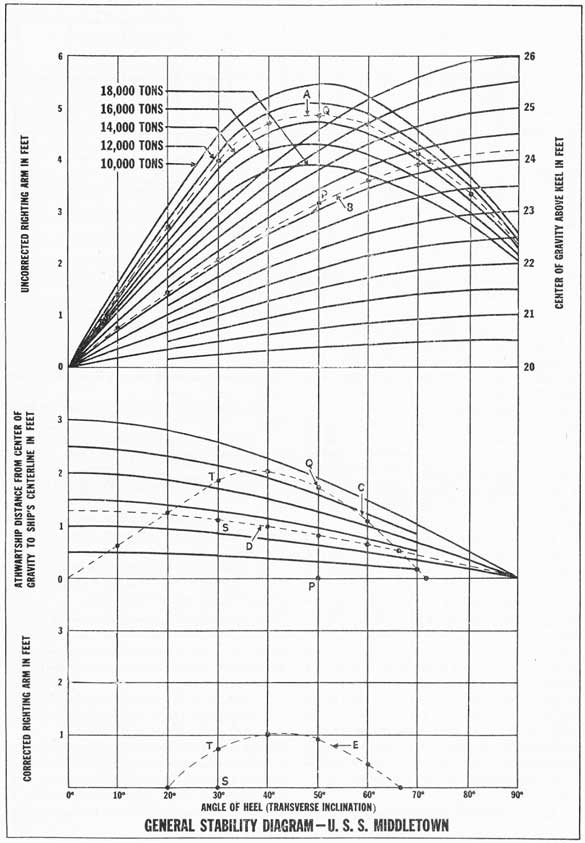
After the displacement and KG are determined it is possible to draw a curve of stability for each condition of load. These curves are included on page 17 of the Booklet of Inclining Experiment Data. Figure 9-1 in this text represents a typical page 17 of the former publication, with the static stability curves for the various conditions. The dotted curves represent
77
Figure 9-1. Curves of stability, U.S.S. MIDDLETOWN.
78
Figure 9-2. U. S. S. MIDDLETOWN; ship in Condition VI, with actual full load.
79
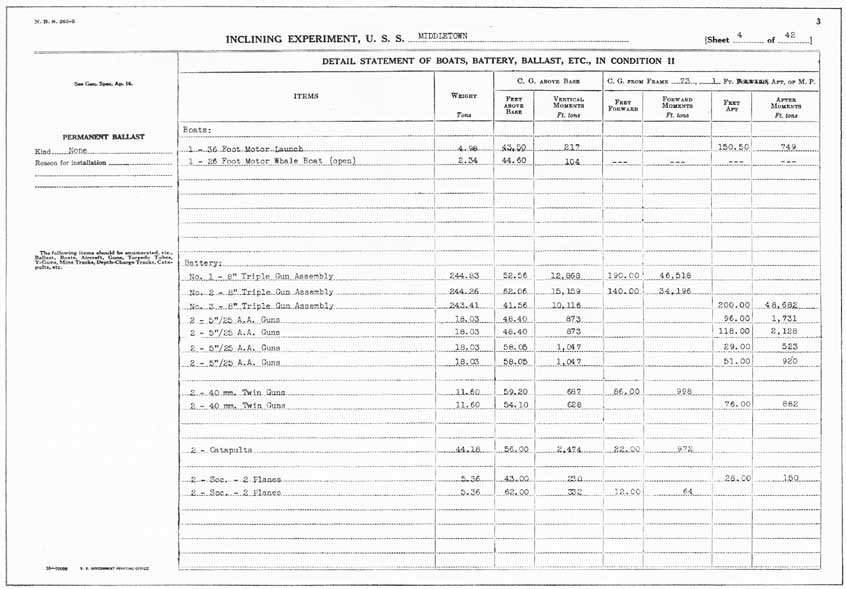
Figure 9-3. U. S. S. MIDDLETOWN; boats, battery, ballast, etc., in Condition II.
80
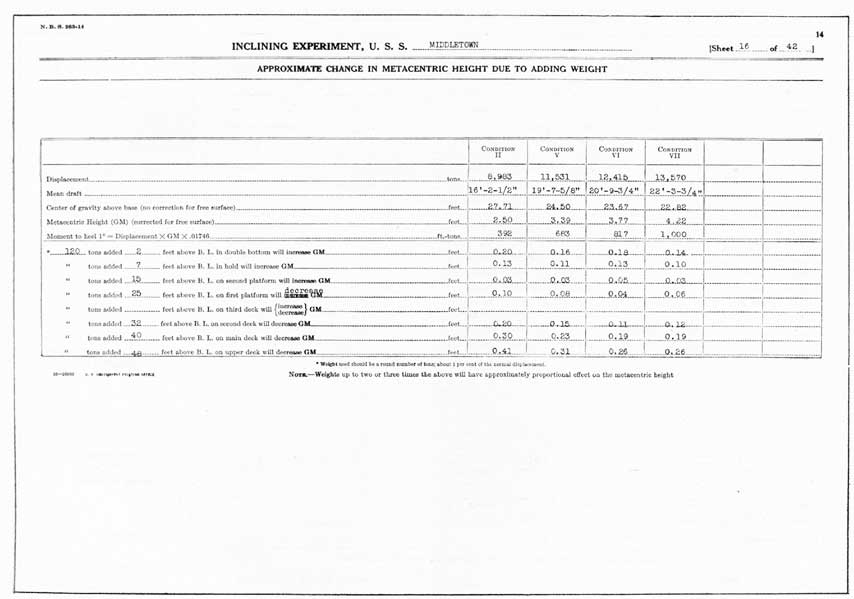
Figure 9-4. U. S. S. MIDDLETOWN; approximate change in metacentric height due to adding weight.
81
Figure 9-5. U. S. S. MIDDLETOWN; displacement and other curves.
82
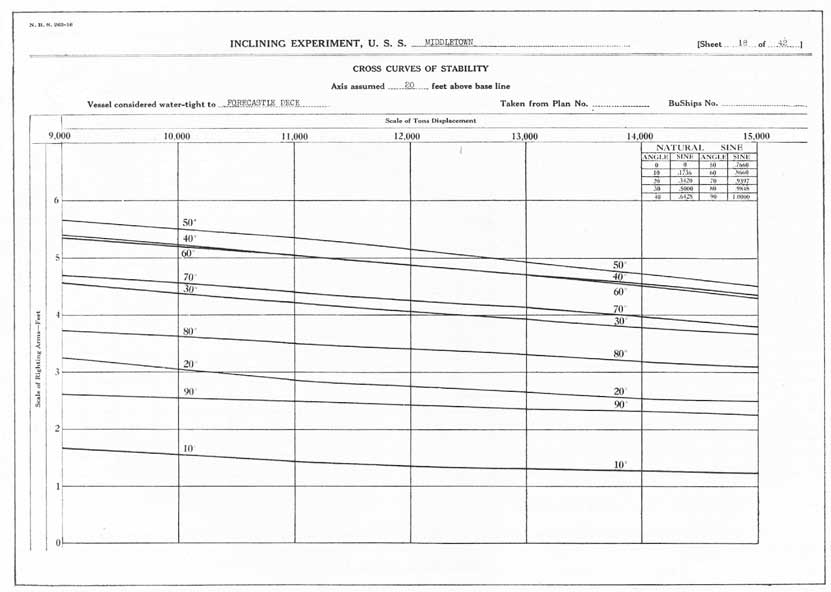
Figure 9-6. U. S. S. MIDDLETOWN; cross-curves of stability.
83
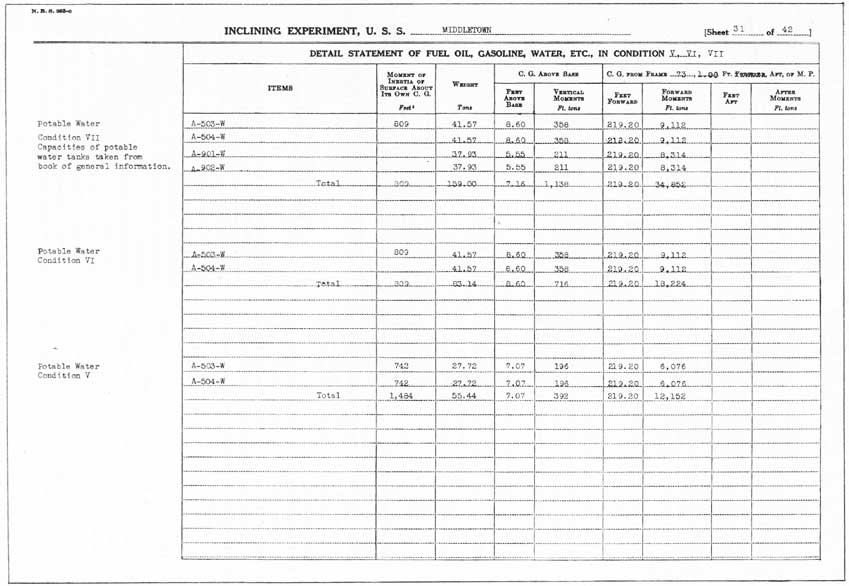
Figure 9-7. U. S. S. MIDDLETOWN; water load in Conditions V, VI, and VII.
84
the condition with no correction for free surface in the ship's tanks. The solid curves are corrected for this free surface.
If a Condition II-A is contained in the Booklet of Inclining Experiment Data, a stability curve is included for that condition also. Operating personnel should not require this information, however, since permanent ballast will not be removed.
9-7. Some items from Booklet of Inclining Experiment Data of particular interest to the forces afloat. (The page numbers indicated herein are standard for all booklets although they may have different sheet numbers).
1. Page 3 (fig. 9-3). Detailed statement of boats, battery, ballast, etc.
2. Pages 7-13 (fig. 9-2). Conditions of loading. These pages contain the data for the specified standard conditions of loading. A summary of the consumable load is included for each condition, together with calculations for KG, GM, and trim.
3. Page 14 (fig. 9-4). Approximate change in metacentric height due to adding weight.
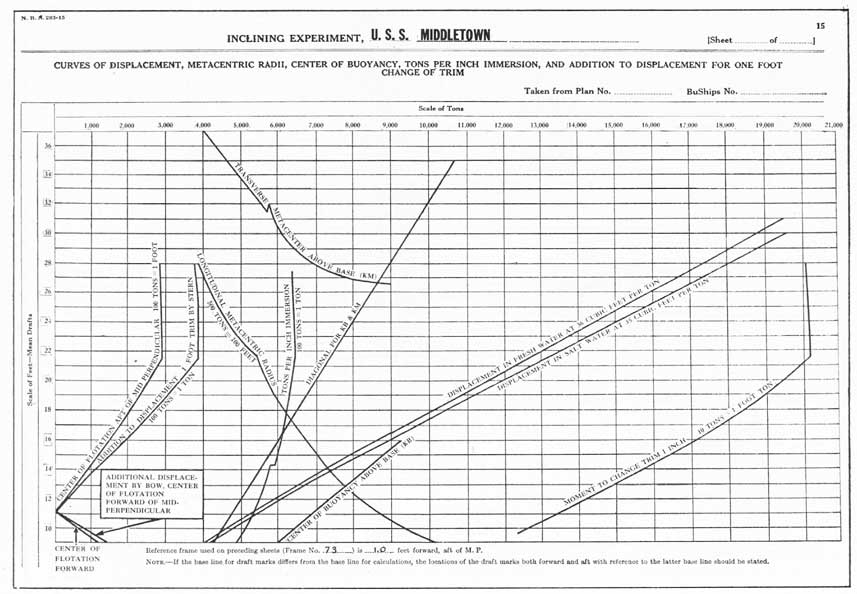
4. Page 15 (fig. 9-5). Displacement and other curves. A detailed description of the curves represented on this page may be found in Chapter XI.
5. Page 16 (fig. 9-6). Cross-curves of stability.
6. Page 17 (fig. 9-1). Curves of stability. Various features of these curves also are presented in tabular form.
7. Page 21 (see fig. 9-7 for water load). Detailed statement of load in various conditions. Included (page 21 to end) are details of the consumable load.
9-8. Flooding effect diagram. The other source from which stability data may be obtained aboard ship is the flooding effect diagram of the Damage Control Book. Indicated on this diagram is the effect of solid flooding various compartments below the waterline and those just above.
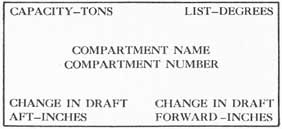
Specifically, the following information for each compartment is listed:
1. Tons of sea water to flood compartment (allowance is made for volume permeability).
2. Change in draft forward and aft resulting from flooding compartment.
3. List caused by flooding compartment.
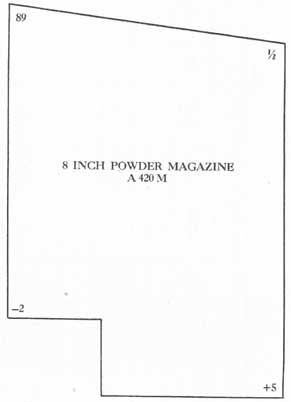
Figure 9-8 represents a typical compartment from the flooding effect diagram. Figure 9-9 explains the various numbers and other designations shown in
figure 9-8. Each compartment on the flooding effect diagram has a distinctive color, depending on the use to which it is put. Ammunition magazines, handling
Figure 9-8. A typical compartment from a flooding effect diagram.
Figure 9-9. Explanation of designation show in figure 9-8.
rooms, and similar spaces are colored pink, water tanks are blue, salt-water tanks and voids are green, etc. The compartment shown in figure 9-8 is colored pink on the flooding effect diagram since it is an ammunition magazine.
Also included in some flooding effect diagrams is a fuel oil sequence table. This table gives the recommended sequence for emptying fuel oil and refilling with salt water. The sequence is based on providing the maximum underwater protection, together with adequate stability and reserve buoyancy. General
85
instructions on filling and emptying other tanks to maintain maximum protection also form a part of the flooding effect diagram.
The information given as to list caused by flooding of any one compartment is based upon a specific displacement and GM. When either or both of these are not as specified, the list created by flooding the compartment will not necessarily be as shown on the flooding effect diagram. This is the situation which usually results in cases of flooding.
When GM and displacement differ from that shown
on the flooding effect diagram, the list to be expected by the flooding of an off-center compartment may be calculated by use of page 14, in the Booklet of Inclining Experiment Data. For various loading conditions, the inclining moment required to heel the ship one degree is listed (see fig. 9-4). This moment may also be calculated from the formula:
Inclining moment =.017 X W X GM.
Where:
W = total displacement of the ship (tons).
GM = metacentric height after the inclining weight is on board (feet).
86
CHAPTER X
LONGITUDINAL STABILITY AND THE EFFECTS OF TRIM
10-1. Longitudinal inclinations. Up to this point only transverse inclinations have been considered. The discussion of longitudinal inclinations will now be. undertaken. A ship pitches longitudinally in contrast to rolling transversely, and a ship trims fore-and-aft, whereas it lists transversely. The important phases of longitudinal inclination are changes in trim and longitudinal stability.
10-2. Trim. Inclinations in the transverse direction are measured by degrees of angle of list. Since the angles of inclination in the fore-and-aft direction usually are very small, the inclinations in this direction are measured by the difference between the forward and after drafts. This difference in drafts is defined as trim. Trim, then, is the difference between the draft forward and the draft aft.
Where the draft aft is greater than the draft forward, the ship is said to be trimmed by the stern; when the draft forward is greater than the draft aft, the ship is said to be trimmed by the bow (or trimmed by the head).
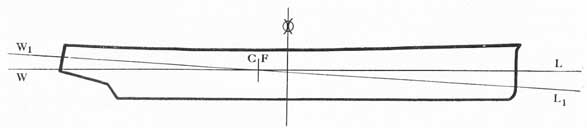
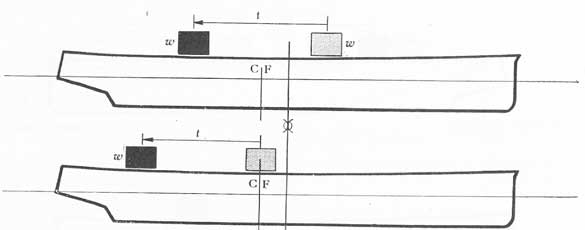
10-3. Center of flotation. When a vessel trims, it inclines about an axis through the center of gravity of the waterline plane. This point is known as the center of flotation. The ship in figure 10-1 has trimmed from waterline WL to W1L1. The axis of rotation for this inclination longitudinally passes through the center of flotation (CF).
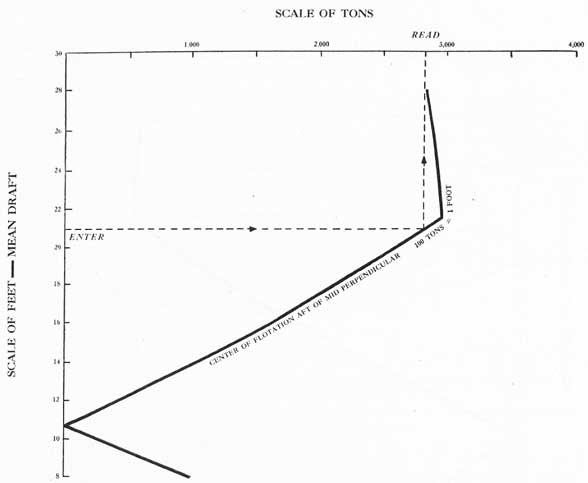
The position of the center of flotation aft of the mid-perpendicular for various drafts may be found
from a curve shown on the curves of form. Figure 10-2 shows a typical center of flotation (center of gravity of waterplane) curve. Read the curve by entering with the mean draft, proceeding horizontally across to the curve, then vertically to the scale of tons. Adjust the value of tons read for the scale factor indicated on the curve.
When a center of flotation curve is not available or precise calculations are not required, the mid-perpendicular may be used in lieu of the center of flotation.
10-4. Change in displacement for one foot change of trim by the stern. The mean draft with which one enters the draft scale to read a displacement curve is the draft amidships. If the ship in figure 10-3 were floating at waterline WL and later trimmed to waterline W1L1 by shifting weights on board displacement would remain constant. Yet draft amidship would be changed because the ship rotates about the center of flotation (not the midship point). When a ship has trim, an average of forward and after drafts (or reading midship draft) does not give true mean draft. Displacement is computed by entering the curves of form with average draft and correcting for trim.
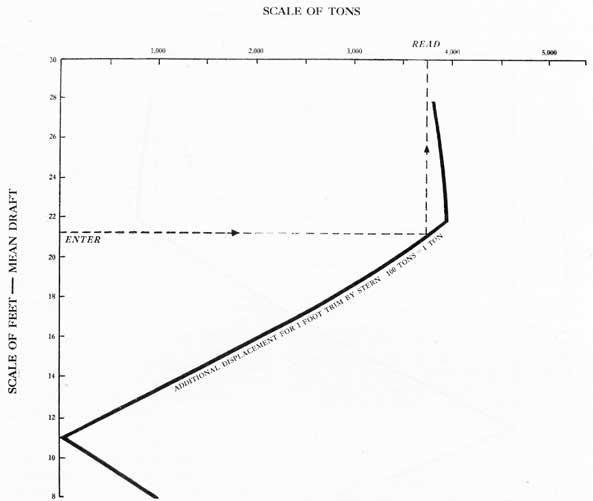
This correction to displacement is obtained from the curve of change in displacement for one foot change of trim by the stern. A typical curve as found in the curves of form is depicted as figure 10-4. At any mean draft the correction for trim may he obtained. For trim by the bow the correction to the displacement is reversed.
Figure 10-1. Diagram to illustrate trim.
87
Figure 10-2. A center of flotation curve.
Figure 10-3.
10-5. Change of trim. Change of trim may be defined as the change in the difference between the drafts forward and aft. Changes of trim are produced by shifting weights forward and aft, or by adding or subtracting weights forward of or abaft the axis about which the ship trims (center of flotation). A shift of weights forward causes a change of trim by the bow. The addition of a weight forward of the center
of flotation increases the forward draft more than the after draft; therefore, the change of trim is by the bow. The reverse holds true when weights are shifted aft, or in the event that they are placed abaft the center of flotation.
The following analysis shows successive drafts of a ship as it passes through consecutive stages of trim due to relocating weights aboard.
88
Figure 10-4. Curve of change in displacement for trim.
Draft Forward
Draft Aft
Trim
Change of Trim
9'-4"
9'-4"
0
-
10'-5"
8'-3"
26" by the bow
26" by the bow
9'-0"
9'-8"
8" by the stern
34" by the stern
8'-3"
10'-5"
26" by the stern
18" by the stern
8'-8"
10'-0"
16" by the stern
10" by the bow
9'-5"
9'-3"
2" by the bow
18" by the bow
As the ship changes drafts in going from 1 to 2, the trim changes from zero to 26 inches by the bow. Therefore, there was a change of trim of 26 inches by the bow. The change of trim is always in the direction of increased draft. From 4 to 5, the trim changes from 26 inches by the stern to 16 inches by the stern,
or a change of 10 inches, and since the forward draft increased, the change of trim is by the bow. A change of trim on a ship depends on the size of the trimming moment producing the change of trim, and the longitudinal stability of the ship.
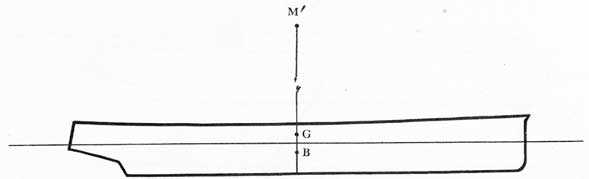
10-6. Longitudinal stability. Longitudinal stability is represented by the tendency of a ship to resist a change in trim. For small angles of inclination the longitudinal metacentric height multiplied by the displacement is a measure of initial longitudinal stability (see fig. 10-5).
The longitudinal metacentric height is designated as GM', and is found from the following formula:
GM' = KB + BM' - KG.
KB and KG are the same as in the case of transverse stability computations. KG is obtained from the inclining experiment, and KB from the curve of vertical center of buoyancy.
89
Figure 10-5. Diagram to illustrate factors used in computing longitudinal stability.
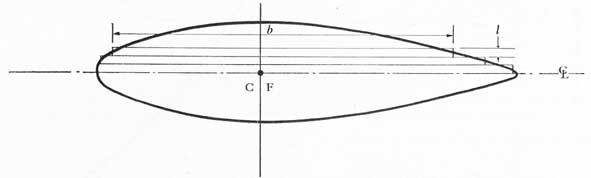
Figure 10-6. Moment of inertia of the ship's waterline plane about an athwartship axis passing through the center of flotation, is equal to the sum of the moments of inertia of rectangles like those shown here.
The distance from the center of buoyancy to the longitudinal metacenter is found in a manner similar to that used in arriving at transverse metacentric radius (BM).
BM' = I' / V.
Where: I' = the moment of inertia of the ship's waterline plane about an athwartship axis passing through the center of flotation.
V = the ship's volume of displacement.
I' is equal to the sum of the moments of inertia of the series of rectangles of figure 10-6. Since the moment of inertia of each of these rectangles is equal to b3l/12 where the cubed dimension, b, is perpendicular to the axis of rotation, the value of BM' is very large-sometimes more than a hundred times larger than BM.
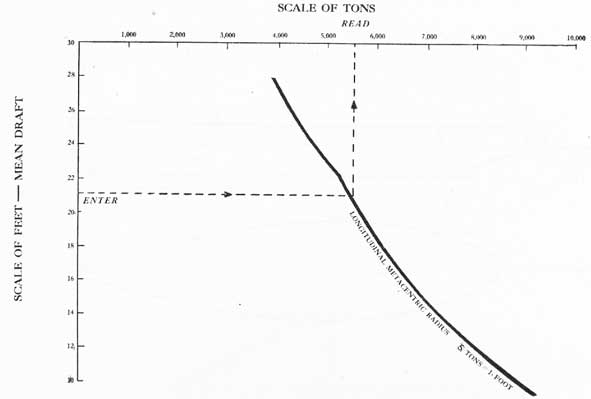
The values of the longitudinal metacentric radius BM' for a particular draft may be found from a curve which is one of the curves of form. This curve is depicted in figure 10-7. For a 22 foot mean draft BM' is 1,030 feet.
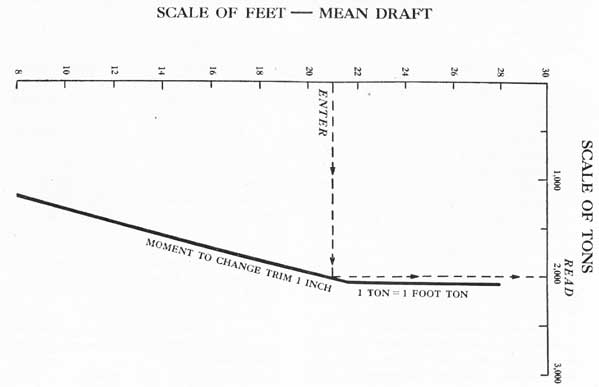
10-7. Moment to change trim one inch. The measure of the ship's ability to resist a change of trim is the moment required to produce a change of trim of a definite amount. Therefore, the moment to change trim one inch is used as the criterion of resistance to
inclination longitudinally. The value of this moment is obtainable from the formula:
MTI = (GM' X W) / 12L
Where: the factor MTI is used to denote moment to change trim one inch.
GM' = longitudinal metacentric height (feet).
W = displacement (tons).
L = length between forward and after perpendiculars (feet).
For practical work BM' usually is substituted for GM' since they are both large, and the difference between them is relatively small. (For Condition VI, Booklet of Inclining Experiment Data (see fig. 9-2), GM' = 1,102 feet and BM' = 1,114 feet.) When BM' is used, MTI is called the approximate moment to change trim one inch. This value may often be found as a curve in the curves of form. In figure 10-8, the approximate moment to change trim one inch at a draft of 24 feet equals 2,050 foot tons.
When such a curve is not available, the approximate moment to change trim one inch may be calculated from the formula:
MTI = (BM' X W) / 12L
90
Figure 10-7. Curve of longitudinal metacentric radius.
Figure 10-8. Curve of moment to change trim one inch.
91
Figure 10-9. Diagram to illustrate factors involved in the computation of trimming moment.
10-8. Trimming moment. The movement of weight aboard ship in a fore-and-aft direction produces a trimming moment. This moment is equal to the weight multiplied by the distance moved. For a relatively small weight added to or removed from the ship, the trimming moment is the product of the weight tames its distance from the center of flotation (see fig. 10-9). When the center of flotation is not known, the mid-perpendicular may be used for approximate calculations,
10-9. Calculation of change of trim. The change of trim in inches may be calculated by dividing the trimming moment by the moment to change trim one inch, as follows:
Change of trim = (w X t) / MTI
The direction of change of trim is the same as that of weight movement. If we are using midships as our axis of rotation, the change in draft forward equals the change in draft aft. This change in draft forward or aft is half of the change of trim. For a change of trim by the stern the after draft increases the same amount that the forward draft decreases; i.e., half the change of trim. The reverse holds true for a change of trim by the bow. For example, a ship with drafts of 20 feet, 6 inches forward, and 22 feet aft has a change of trim of 10 inches by the bow. The forward draft increases 5 inches to 20 feet 11 inches and the after draft decreases 5 inches to 21 feet 7 inches.
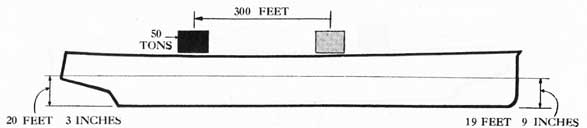
10-10. Effect of weight movement upon draft. If 50 tons of ammunition are moved 300 feet aft on the ship shown in figure 10-10, what are the new drafts?
Trimming moment 50 X 300 = 15,000 foot tons.
Moment to change trim one inch = (from curve of fig. 10-8) = 1,940 foot tons.
Change of trim = 15,000/1,940 = 8 inches by stern.
Change of draft = -4 forward, +4 aft.
New draft forward = 19 feet, 5 inches.
New draft aft = 20 feet, 7 inches.
10-11. Adding weight at the center of flotation. The addition of a weight any place on the ship increases the mean draft. If the weight is added at or directly above or below the center of flotation the ship will not change trim. A weight added at the center of flotation changes all drafts by the same amount as that of the mean draft. The removal of a weight at the center of flotation will decrease all the drafts the same amount.
10-12. Adding weight at any position longitudinally. To determine the change in drafts forward and aft due to adding a weight any place on the ship, the effect of the weight addition is computed in two steps. First, the weight is assumed to be added at the center of flotation. When this is done the mean draft and all the drafts increase by the same amount. This increase is equal to the weight added, divided by the tons per inch immersion. With ship at its new drafts, the weight is assumed to be moved to its ultimate location. Moving of the weight fore-and-aft produces a trimming moment and therefore a change in trim. The change in trim is calculated as indicated in Article 10-9.
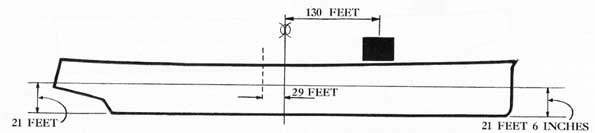
10-13. Example of the effect of adding weight. A ship with drafts of 21 feet 6 inches forward and 21 feet aft is taking on 420 tons of load 130 feet
92
Figure 10-10. Diagram to illustrate the problem in Article 10-10.
Figure 10-11. Diagram to illustrate the problem in Article 10-13.
forward of midships (see fig. 10-11). What are the final drafts and trim?
Solution:
Draft forward = 21 feet, 6 inches.
Draft aft = 21 feet.
Mean draft = 21 feet, 3 inches.
Displacement = 12,750 tons (from curves of form).
Tons per inch immersion = 64 tons/inch (from curves of form).
Increase in mean draft = 420/64 = 6 1/2 inches.
New mean draft = 21 feet, 9 1/2 inches.
New draft forward = 22 feet, 1/2 inch.
New draft aft = 21 feet, 6 1/2 inches.
Center of flotation is 29 feet aft of mid-perpendicular (from curves of form).
Trimming moment = 420 X (130 +29) = 66,780 foot tons.
Moment to change trim 1 inch = 2,000 foot tons (from curves of form).
Change of trim = 66,780/2,000 = 33 inches.
Change of draft = +16 1/2 inches forward.
-16 1/2 inches aft.
Final draft forward = 23 feet, 5 inches.
Final draft aft = 20 feet, 2 inches.
Trim = 3 feet, 3 inches by the bow.
10-14. Change of drafts on flooding effect diagram. From the flooding effect diagram of the Damage Control Book it is possible to obtain the change in draft forward and aft due to solid flooding of a compartment.
The weight of water to flood solid any given compartment also is indicated on the flooding effect diagram. The trimming moment produced by the flooding of any compartment may be computed upon the basis of this information.
10-15. Drag. Some of the smaller ships are designed with a trim by the stern. This designed trim is known as drag. In measuring the trim for calculation purposes (ship with a drag), the trim is the difference between the draft forward and aft in excess of the drag. For example, a ship with drafts of 9 feet forward and 12 feet aft with a drag of 3 feet has zero trim. If the drafts are 8 feet forward and 13 feet aft, the trim is 5 feet minus 3 feet or 2 feet by the stern.
10-16. Excessive trim. Too much trim either by bow or stern may impair the efficient operation of the vessel. With the ship considerably away from its designed lines, the ship's maximum speed is reduced, and more fuel oil must be burned in order to maintain a given speed. Excessive trim forward may not allow sufficient propeller tip immersion; also driving into a sea with considerable trim forward makes for a very wet forward deck.
In the drydocking of a ship, trim in excess of one foot per hundred feet of length may make the docking operation hazardous. The docking officer usually will try to bring the trim below this limit before attempting to dock the ship.
10-17. Effect of trim on transverse stability. The curves of form prepared for a vessel are based upon the designed conditions; i.e., with no trim. For most
93
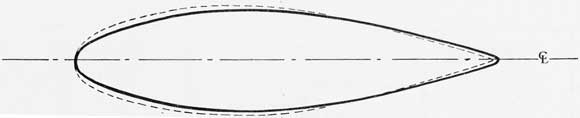
Figure 10-12. Waterplanes of a ship with zero trim (solid line) and with trim by the stern (dotted line).
types of ships, as long as the trim does not become excessive (more than about 1% of the length), the curves are still applicable, and may be used without adjustment.
When a ship trims by the stern, the transverse meta-center is slightly higher than indicated by the KM curve, because both KB and BM increase. The center of buoyancy rises because of the movement of a wedge of buoyancy upward. The increased BM is the result of an enlarged waterplane as the ship trims by the stern.
Figure 10-12 shows a waterplane for a ship with zero trim and with trim by the stern. The dotted line indicates the trimmed ship. This is especially true in the case of ships with V-flared sections astern and U-shaped sections forward.
Trim by the bow usually means a decreased KM. The center of buoyancy will rise slightly, but this is usually counteracted by the decreased BM caused by the lower moment of inertia of the trimmed water-plane.
94
CHAPTER XI
CURVES OF FORM
11-1. Displacement and other curves, or curves of form. The displacement and other curves or curves of form are a set of curves which show the various geometric properties of a ship's underwater body. The curves are made up by either the Bureau of Ships or a design activity, from the lines of the ship. A number of these curves have been explained in the foregoing subject matter to which they apply. A reduced-size set of the curves is included as page 15 of the Booklet of Inclining Experiment Data. Figure 9-5 depicts page 15 of the booklet for the U.S.S. MIDDLETOWN.
A large number of ships have the same hull form even though their internal arrangements or armament may differ. A single set of curves of form is applicable to all ships with the same underwater body.
Each curve depicts a different property of the hull form for various drafts. The range of drafts covered extends from zero to somewhat above the maximum operating draft to be expected. All curves are drawn for the ship floating at waterlines parallel to designed waterline; i.e., with zero trim or list. The base line for the curves is through the bottom of keel amidships unless otherwise indicated. For a ship with drag, the base line may be either at the bottom of keel amidships or at the lowest point of keel.
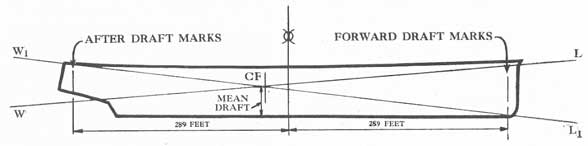
11-2. Drafts and draft marks. Since the different properties of the hull form are plotted for the various drafts of the ship, it is necessary to obtain the correct mean (average) draft of the vessel in order to use the curves of form. The mean draft of a vessel is the average of the drafts at the forward and after perpendiculars.
It usually is a physical impossibility to place the draft marks exactly at the perpendiculars but they generally are equidistant from the mid-perpendicular. When the draft marks are not equidistant, the mean draft is no longer the average of the forward and after drafts. Hence, the mean draft must be obtained either from the draft diagram or by use of the method
explained below. The mean draft is equal to the smaller of the drafts forward or aft plus the value of:
a/l X trim.
Where: a = the distance from the smaller draft marks to midship. l = the distance between the draft marks.
All ships have at least two sets of marks-forward and aft. Some ships may have a set (port and starboard) at midship which gives a direct reading of mean draft. Vessels having projections below the keel normally are provided with additional sets of draft marks for calculation purposes only.
Navigational draft marks (Arabic numerals) are so located as to indicate operating drafts including those projections, if any, below the keel of the vessel. These draft marks are six inches in vertical projected height, the foot of the draft being indicated by the bottom of the mark. Navigational draft marks greater than nine feet are indicated by the last digit only. Thus for a draft of 28 feet, the waterline would be at the bottom of an eight.
Roman numeral draft marks, when provided, always indicate the draft of the vessel measured from the bottom of the keel. They are used for determining the displacement and other properties of the vessel in connection with the curves of form or draft diagram. They are three inches in vertical projected height, the feet of the draft being indicated by the bottom of the mark and the six-inch intervals being indicated by the lower edge of a horizontal bar.
Internal draft gauges or indicators are calibrated to read the draft above the bottom of the keel at the longitudinal position of the gauge.
11-3. Reading drafts. For using the curves of form, read Roman numeral draft marks if present. Otherwise, use the Arabic marks, and correct the reading for projections below the keel, if any exist. These projections may be found by consulting the ship's docking plan or the draft diagram. The docking plan usually
95
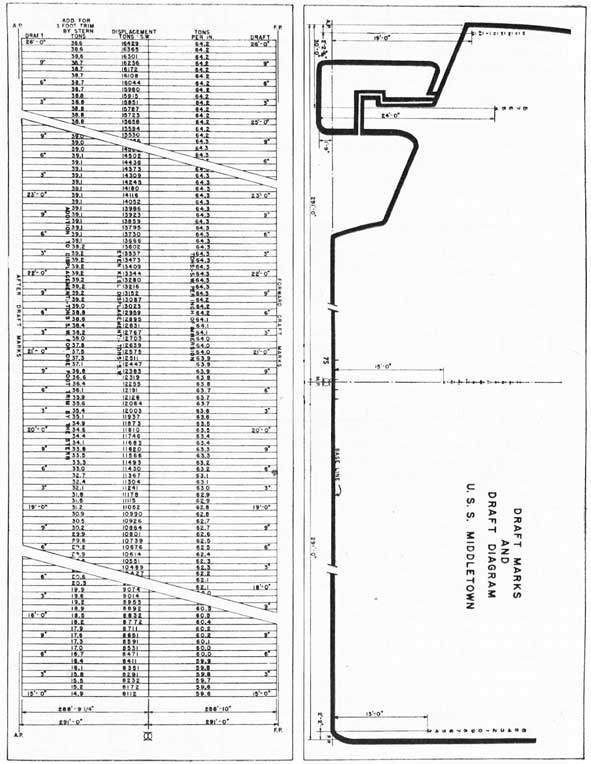
Figure 11-1. U.S.S. MIDDLETOWN; draft diagram.
96
is more up to date, and therefore is recommended. Drafts marks on both sides of the ship should be read; a slight list will affect the midship and after drafts considerably.
The reading of the midship drafts (port and starboard) may be used for the mean drafts for application to the curves of form. If these marks are Arabic they should be corrected for the projection existing below the keel.
In the case of a ship designed with a drag, check the base line of the curves of form, and adjust the drafts to this base line before using the curves.
The reading of drafts when the water is choppy or when the ship is underway is not recommended, since the values thus obtained may he considerably in error.
11-4. Displacement curves. The displacement curves depict the displacement of the ship in salt water and fresh water for various drafts. When only one displacement curve is drawn, it is for a ship floating in salt water with a density of 35 cubic feet per ton. Figure 9-5 shows a displacement curve for a ship floating in fresh water also-36 cubic feet per ton.
To read the displacement for any mean draft, enter the vertical scale of feet at the left with the mean draft and proceed horizontally to the displacement curve. Then proceed vertically up to the scale of tons along the top and read the displacement in tons directly. Thus, for the U.S.S. MIDDLETOWN (fig. 9-5) at 20 feet draft, displacement is 11,900 tons in salt water.
11-5. Tons per inch immersion curve. This curve shows the change in displacement accompanying a one-inch change in mean draft at various waterlines. It indicates the amount of weight that must be added or removed from the ship to produce a change in mean draft of one inch.
To read the curve, enter with mean draft prior to the weight change on the scale at the left, go horizontally out to the curve, and then up to the scale of tons. Correct this value in tons for the scale factor indicated on the curve; usually 100 tons equal 1 ton. For example, at 20 feet draft, tons per inch immersion is 63 tons (see fig. 9-5).
11-6. Diagonal for KB and KM curves. The diagonal (not a curve of form) is a straight line used in conjunction with the reading of the curves of vertical center of buoyancy (KB) and transverse metacenter (KM). The line is established at a predetermined and convenient angle, usually but not necessarily 45°.
Newer curves of form do not include the diagonal. In such case, the KB and KM curves are read like other curves. Enter with the mean draft, proceed to the
curve, and then vertically to the scale of tons, making the necessary scale factor correction.
11-7. Vertical center of buoyancy (KB). The vertical position of the center of buoyancy is obtained from the KB curve. The diagonal is used in conjunction with this curve so that the value of KB may be read directly on the mean draft scale of feet, without employing a scale factor adjustment. To read KB, enter with the mean draft, proceed horizontally to the diagonal, then vertically down to the KB curve, and horizontally to the left to the scale in feet. For example, if draft is 20 feet, KB equals 11.3 feet (see fig. 9-5).
11-8. Transverse metacenter (KM). The vertical position of transverse metacenter above the base line may be found from the KM curve. It is read by using the diagonal as in the case of the KB curve. Sometimes a special scale in feet is superimposed on the draft scale for reading the value of KM.
To read KM, enter with the mean draft, proceed horizontally to the diagonal, up to the KM curve, and horizontally to the scale of feet on the left. Thus KM for 20 feet draft is 27.9 feet (see fig. 9-5).
11-9. Longitudinal metacentric radius (BM'). The curve for the longitudinal metacentric radius is read by entering with the mean draft, proceeding horizontally to the curve and up to the scale of tons at the top. The value in tons must be corrected according to the scale factor. Thus BM' for 20-foot draft (fig. 9-5) is 1,140 feet.
11-10. Moment to change trim one inch (MTI). This curve gives the moment in foot tons required to change trim one inch either by bow or stern. The curve is sometimes labeled approximate moment to change trim one inch because BM' has been used in its determination instead of the exact value of GM' (see Art. 10-7).
To read the curve, enter the scale of feet with the mean draft, proceed horizontally to the curve, and up to the scale of tons above. Adjust for the scale factor. Thus, moment to change trim one inch at a 20-foot draft is 1,950 foot tons (fig. 9-5).
11-11. Center of flotation (CF). The curve of the center of flotation is often labeled center of gravity of waterplane forward or aft of mid-perpendicular (see Art. 10-3). Sometimes this curve may have values forward or aft of a reference frame or station rather than the mid-perpendicular.
To read the curve, enter at the mean draft, proceed horizontally to the curve, and then up to the scale of
97
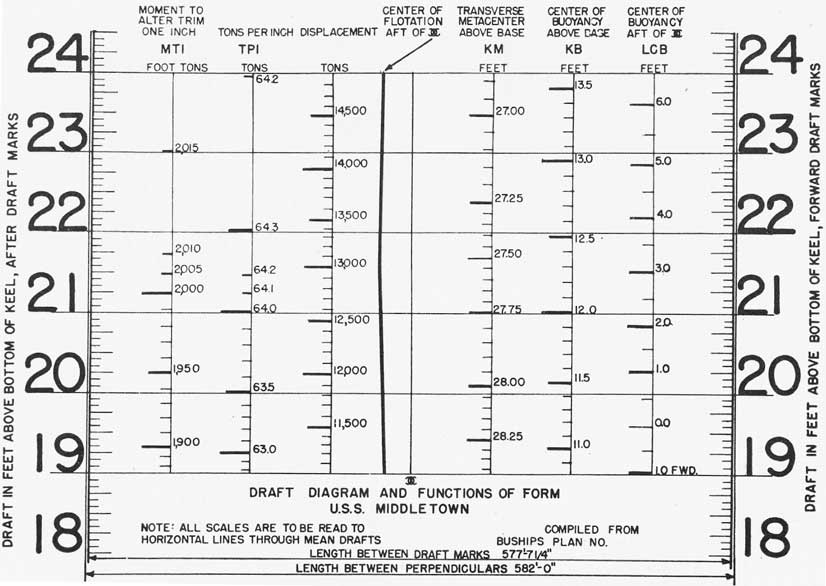
Figure 11-2. U.S.S. MIDDLETOWN; draft diagram and functions of form.
98
tons, making the necessary scale factor correction. For a draft of 20 feet (fig. 9-5), the center of flotation is 26 feet aft of midships.
11-12. Addition to displacement for one foot trim by stern. Since the displacement curve is plotted for a ship with no trim, the correction to displacement for trim may be found from this curve of addition to displacement for one foot trim by the stern. When the ship trims by the bow, the displacement is decreased by the amount shown on the curve (see Art. 10-4).
To determine the correction to displacement for a trim by the stern, enter with the mean draft, proceed horizontally to the curve, and then up to the scale in tons, correcting for the scale factor. Multiply the value thus corrected by the number of feet of trim. For example, addition to displacement for one foot of trim by the stern at 20 feet mean draft is 34.5 tons (see fig. 9-5).
11-13. Other curves. Curves other than those mentioned heretofore often are included among the curves of form. They are not discussed here because they have little practical value in damage control.
11-14. Accuracy of curves of form. There may he slight inaccuracies in the values obtained from the curves due to irregularities in the shape of the hull, but these generally are well within the accuracy with which the drafts can be read.
It should be remembered that the curves apply to the intact hull; however, with proper corrections they may be used in determining values for a damaged ship. When part of the bow or stern is missing, however, these curves no longer apply, even though the remainder of the ship may be intact. New curves must also he prepared when the underwater body is permanently altered, as by the addition of sponsons or blisters.
The position of the center of gravity of the ship has no effect on the curves of form. Also, alterations of the internal structure, machinery, or topsides does not in any way affect the validity of a set of curves.
11-15. Draft diagram. The draft diagram is a plan prepared to present some of the data shown on the curves of form in a more usable form. The draft diagram is issued to combatant ships as one of the ship's finished plans (see fig. 11-1)
There are two parts to the diagram, as follows:
1. A profile of the ship showing the longitudinal and vertical location of all draft marks with reference to the perpendiculars and the bottom of keel. A curve of the center of flotation may also he drawn on this profile.
2. A graph (nomograph) on which tables of displacement, tons per inch immersion, and additions to displacement for one foot trim are tabulated for the corresponding drafts. A center of flotation curve may be substituted for the table of addition to displacement for one foot of trim.
The nomograph is used in the following manner: On the corresponding scales enter with the draft for-ward and aft. Draw a straight line between the value of the forward draft and after draft. This straight line intersects the mid-perpendicular line at the mean draft of the ship. With this mean draft read the displacement corresponding, making corrections for fractions of an inch of draft and for the trim either way.
If a center of flotation line has been incorporated, the intersection of the straight line with the center of flotation line will give the true mean draft of the ship corrected for trim. The displacement corresponding to this draft would not need a trim correction.
11-16. Example of the use of a draft diagram. U.S.S. MIDDLETOWN has drafts of 19 feet 4 inches forward and 21 feet 9 inches aft. What is the displacement?
Mean draft - 20 feet 6 1/2 inches (from draft diagram).
Displacement at 20 feet 6 inches is 12,191 (from draft diagram).
TPI = 63.7 (from draft diagram).
1/2 inch X 63.7 TPI = 32 tons.
12,191 + 32 = 12,223 tons.
Correction for 1 foot trim by stern = + 36.1 tons (from draft diagram).
Correction for 2 foot five inch trim by stern = 2.4 X 36.1 = 87 tons.
Total displacement = 12,223 + 87 = 12,310 tons.
11-17. Draft and form diagram. The draft and form diagram (fig. 11-12) is a nomograph similar in type to the draft diagram. It contains the same data as that on the graph of the draft diagram, together with some additional properties of the hull form for which curves of form have been drawn. In tabular form values of KB, KM and moment to change trim one inch are included for the corresponding mean draft.
This diagram has been prepared for a limited number of ships to date. It can easily he made up by the damage control officer for his own ship, using values taken from the curves of form.
99
CHAPTER XII
THE GENERAL STABILITY DIAGRAM
12-1. Purpose of the general stability diagram. In the preceding Chapters it has been shown that stability characteristics can be portrayed as certain properties of the stability curve. It has also been shown that weight additions or removals change stability characteristics. The changes involved can be accounted for in the following manner:
1. Take a new righting-arm curve from the cross-curves for the new value of displacement.
2. Make a sine-curve correction for the final vertical height of the center of gravity.
3. Make a cosine-curve correction for the final off center position of the center of gravity.
4. Multiply the resulting righting arms by the new displacement to provide a curve of righting moments.
Steps 1, 2, and 3 require laborious selection, calculation, and plotting in order to provide a correct righting-arm curve for use in 4. The work of obtaining a corrected righting-arm curve is greatly simplified by the use of a chart known as the general stability diagram. This diagram is of value, not only for purposes of obtaining curves, but also because it indicates the effects to be expected from various types of weight changes.
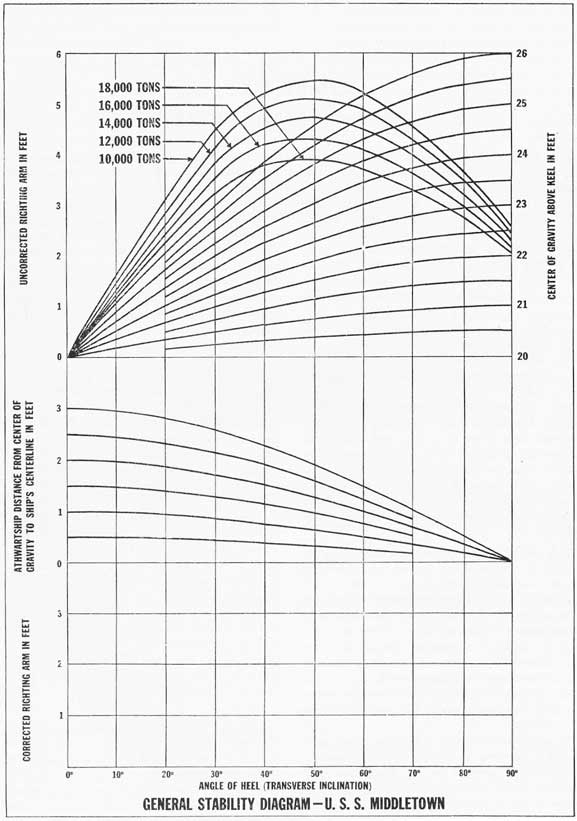
12-2. Description of the general stability diagram. A typical example of the diagram is reproduced in figure 12-1 (reduced to half size). It consists of a grid which is divided into three groups-upper, middle, and lower. In the upper group, two sets of curves are printed on the diagram for use. These are:
1. A family of uncorrected righting-arm curves plotted directly from the cross-curves (for successive intervals of displacement).
2. A family of superimposed sine curves for correcting the stability curves (for successive heights of G).
The middle group contains a family of cosine curves to use in correcting the stability curve for athwartship location of the center of gravity. The bottom group provides a blank grid in which to plot the resulting curve of residual righting arms.
12-3. Use of the general stability diagram. The following steps are necessary in making use of the diagram:
First step:
Select a stability curve in the upper group which corresponds to the displacement of the ship for which a curve is desired. This is done by selecting two of the printed stability curves whose displacements straddle the required value. Then draw a pencil line between the two, keeping this line a proportional distance between them to correspond to the relative size of the given displacement and the displacements of the two curves selected.
Second step:
Select a sine curve in the upper group whose 90° value corresponds to the KG for which the stability curve is to be corrected. To do this, enter the right-hand scale of the upper group with the final height of center of gravity above the keel, and draw a pencil line between two of the sine curves whose 90° scale value straddles the given KG. Keep this pencil line proportionally spaced between the two curves.
Third step:
Transfer intercepts from the upper group down to the middle group. (If there are no off-center weights, go directly from the upper to the lower group.) With a pair of dividers (a ruler or the edge of a piece of paper will do as well) pick off the vertical distance at any angle of heel from the sine curve selected to the stability curve selected in the upper group. Plot this distance above the base of the middle group at the proper angle of heel. When intercepted distances have thus been moved down for 10°, 20°, 30°, and so on to the range of stability, a smooth pencil curve can be faired through the points.
Fourth step:
Select a cosine curve in the middle group whose 0° value corresponds to the athwartship distance from G to the centerline. Enter the left-hand scale of the middle group with the final value of G1G2, the horizontal distance from center of gravity to centerline. Draw in a pencil line between the two cosine curves
100
Figure 12-1. U.S.S. MIDDLETOWN; general stability diagram.
101
Figure 12-2.
102
Figure 12-3.
which straddle this given inclining arm, keeping a proportional distance between them.
Fifth step:
Transfer intercepts from the middle group down to the lower group. Use dividers as before to pick off distances between the righting-arm curve and the cosine curve which was selected in the middle group. Plot these distances above the horizontal scale of the lower group at the proper angles of heel. When points have been plotted for every ten degrees from 10° to the limit of positive stability, locate the two angles on the base of the lower group which establish the range of stability. These are the angle of list and the angle of vanishing stability. They are to be found in the middle group at the two points where the inclining-arm curve crosses the righting-arm curve.
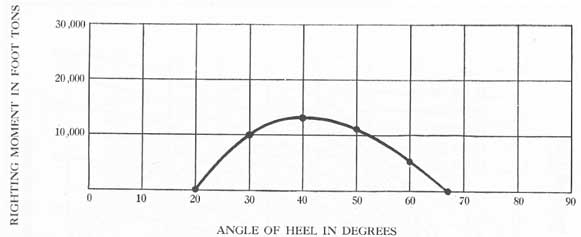
Fair a smooth curve through the points plotted in the lower group, and the result is the object sought: a curve of stability which is correct for freeboard, vertical height of G, and athwartship location of G. It remains only to multiply the residual righting arms by displacement to produce a curve of righting moments.
Note: If the angle of permanent list is known, but the amount of off-center weight is not known, it is possible to select a cosine curve in step four by locating the intersection of a vertical line at the angle of list with the righting-arm curve brought to the middle group from the upper group. The intersection thus found is a point on the inclining-arm curve, and the latter is thereby located with respect to its proportional spacing between two of the printed cosine curves.
Problem:
Construct a curve of righting moments for U.S.S.
MIDDLETOWN, using the general stability diagram, for the following condition:
First step: Draw in curve A as shown in figure 12-2.
Second step: Draw in curve B as shown in figure 12-2.
Third step: Transfer distances such as PQ from the upper to the middle group (fig. 12-2), establishing curve C.
Fourth step: Draw in curve D as shown in figure 12-2.
Fifth step: Transfer distances, such as ST, from the middle to the lower group (fig. 12-2), establishing curve E.
The product of multiplying curve E by 13,000 tons has been plotted on the grid of figure 12-3 to furnish the required curve of righting moments.
12-4. Data needed for use of the general stability diagram. The general stability diagram can be used to provide an accurate curve of righting arms whenever the following three items are accurately known:
1. Displacement.
2. Height of ship's center of gravity above keel.
3. Distance from center of gravity to centerline (or angle of list, whichever is known).
When a ship's loading is altered sufficiently to produce a noticeable change in stability, it is rarely a case of only one weight having been added or removed. It is more likely that several weights have been added in different locations, and that this has been accompanied
103
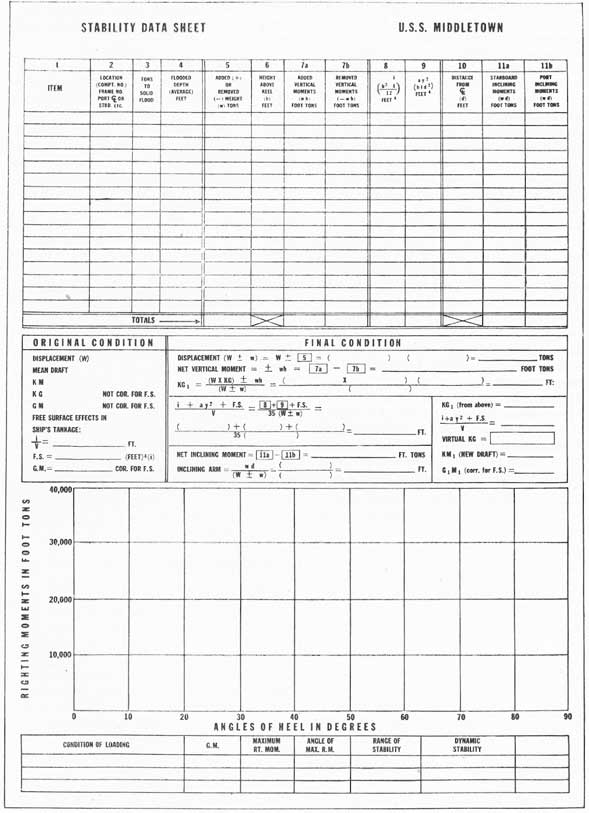
Figure 12-4. A stability data sheet.
104
by the removal of weights in other spots. In such a case, obtaining the above three factors for use in the general stability diagram becomes complicated and confusing, unless a definite form is provided for systematically entering values and computing the result. A form of this type, reduced to half size, is reproduced as figure 12-4.
Since this form contains the data necessary to compute a change of stability, it is referred to as a stability data sheet, It contains columns in which to enter added or removed weights. Columns also are provided for vertical moments (wh) used in calculating the new KG, and inclining moments (wd) used in calculating how far G is off the centerline.
In Chapter VIII it was shown that free surface effect and free communication effect may be regarded as producing a virtual rise in G. If the added weight is a liquid which has a free surface, the value of i/V should be added to KG. And if free communication exists, the value of ay2/V should also be added to KG. It is the resulting virtual height of G that is used to select a sine curve in the upper group of the general stability diagram. Consequently, the stability data sheet has columns for adding up free surface and free communication effects.
Formulas, and blanks for their use, are printed on the sheet. The grid on the lower part of the sheet is provided for plotting the curve of righting moments obtained by multiplying the righting-arm curve produced in the general stability diagram by displacement. At the bottom of the stability data sheet a form is given
in which to tabulate a comparison of the stability characteristics as found for certain standard conditions of loading.
12-5. Dependability of results. If the general stability diagram is used to obtain a curve of righting arms for an added (or removed) solid weight, the results are as accurate as the data used to enter the diagram. But if the added weight is loose water which has a free surface or is in free communication with the sea, then an approximation is introduced.
The approximation is due to the fact that when free surface effect or free communication effect is added to KG, a resulting correction curve of (i/V) sin θ or of (ay2/V) sin θ, is used in the upper group of the diagram. The correction curve does not allow for the effect of pocketing on loose water (see Chapt. VIII). Pocketing cuts down the loss of righting arm as angle of heel increases. Therefore, the diagram, in giving a result which neglects pocketing, shows less stability than actually exists.
There is a second factor which may or may not render the product of the general stability diagram conservative. Surface permeability tends to cut down the effect of loose water. The lower the surface permeability factor, the smaller the loss of righting arm. To evaluate surface permeability multiply i/V and ay2/V by s. If s is neglected, the results show a worse condition than actually exists, but are in most cases fairly accurate, due to the fact that s is close to unity for a majority of compartments.