4-1. Foreword. As noted in Chapter III, vessels tend to remain upright and resist capsizing when inclined because they develop a righting moment. At any angle of heel, the value of the righting moment is displacement in tons times the distance between buoyant force and weight (called righting arm) in feet. In other words:
Righting moment = W X GZ.
Where: W = displacement in tons (2,240 pounds).
GZ = righting arm in feet.
There are certain factors which may cause either W or GZ to vary. It is the purpose of this discussion to consider some of these variations, and to develop a method of describing a ship's total stability characteristics.
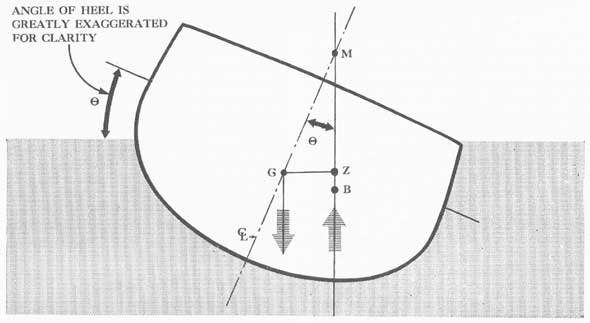
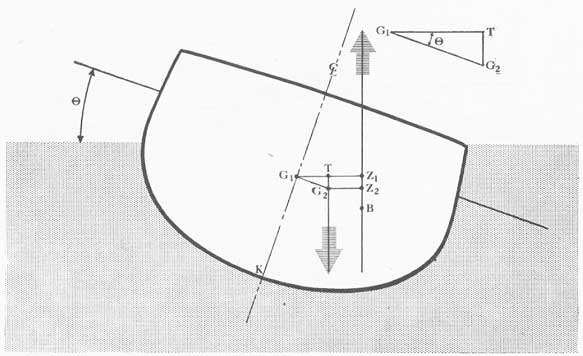
4-2. Righting arm and angle of heel. If the angle of heel is small, the metacenter may be regarded as being fixed. In this case a triangle is formed, whose sides are GM, GZ, and the line of action of the buoyant force (triangle GZM in fig. 4-1), in which the apex angle (GMZ) is the angle of heel. The angle
between GZ and the buoyant force (GZM in fig. 4-1) is a right angle. Considering this right-angle triangle, it is evident that if GM remains constant, GZ will become larger as the angle of heel is increased.
For convenience, designate the angle of heel (GMZ) by the Greek letter θ. Then the relation between metacentric height and righting arm for small angles may be expressed as:
GZ = GM X sin θ.
But, righting moment = W X GZ.
Therefore, righting moment = W X GM X sin θ.
In other words, righting moment equals displacement times metacentric height times the sine of the angle of heel. As the ship rolls, W remains constant. If it does not roll more than about 10° from the upright, GM remains practically constant. Initial stability consists of these two constants (GM and W) times a ratio called the sine of an angle. Consulting a table of sines will reveal that as the angle gets larger, the sine increases. Consequently, as the ship heels farther the righting moment gets larger.
Figure 4-1. Diagram to illustrate the relationships existing among metacentric height, righting arm, and angle of heel.
38
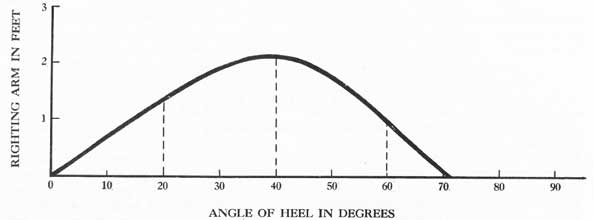
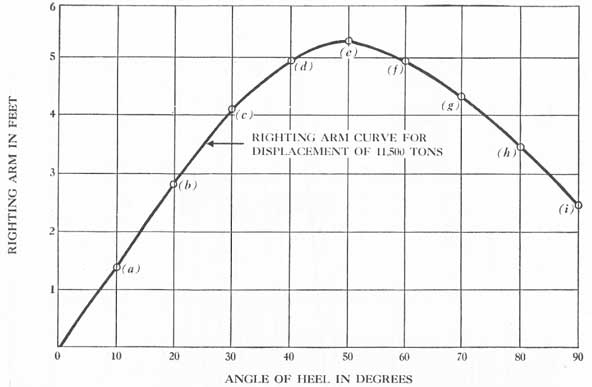
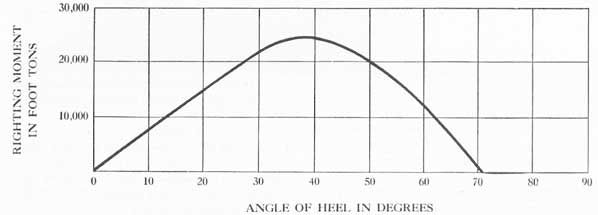
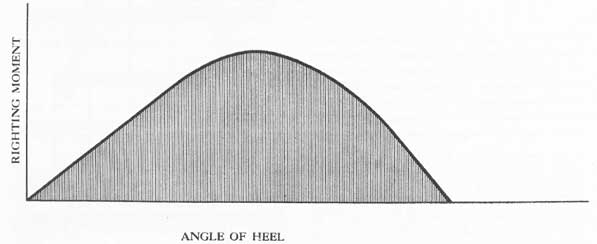
Figure 4-2. A curve of stability.
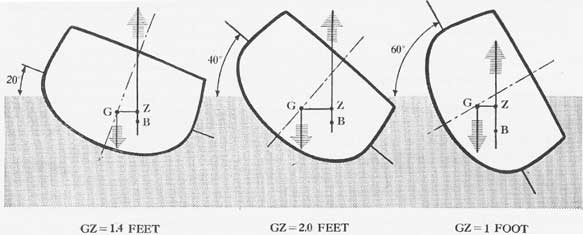
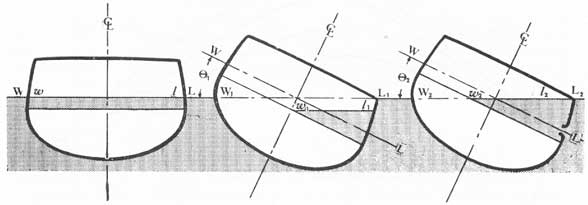
Figure 4-3. A ship inclined at successively larger angles of heel. Note how the righting arm becomes larger and then smaller in correspondence with the curve of figure 4-2.
The expression W X GM X sin θ is adequate to describe and evaluate initial stability. However, as the angle of heel increases, the metacenter moves from its initial position, thus causing GM to vary. The value of GM is now no longer a measure of stability, and it is necessary to express stability at large angles of heel in terms of righting moments or righting arms.
4-3. Curve of stability. In view of the fact that stability varies with the angle of inclination, it is necessary to express stability at greater angles of heel in terms of a series of righting moments for successive angles of heel. With displacement (W) remaining constant as the ship rolls, the righting arms may be used instead of moments, bearing in mind that the moment can always be readily obtained if one multiplies the arm by displacement.
Using graphic means, it is possible for a design activity to determine the distance GZ for any given angle of heel. A series of values of GZ for successive
angles of heel is thus obtained, and it would be entirely feasible to supply them to the ship in tabular form. But it is more convenient and much more expressive to represent them as a curve of righting arms plotted against angles of heel. Such a diagram is called a curve of static stability. The word "static" means that it is not necessary for the ship to be in motion for this curve to apply; if the ship were momentarily arrested at any angle during its roll, the value of GZ (and righting moment) given by the curve would still remain in effect, assuming that the water is calm.
Figure 4-2 is a typical curve of stability in which a series of righting arms is plotted vertically against corresponding angles of heel which are plotted horizontally. This curve indicates that initial stability increases with angle of heel at almost a constant rate, but at larger angles the increase in GZ begins to level off. Then GZ gradually diminishes, finally becoming zero when the ship is almost on her beam ends.
39
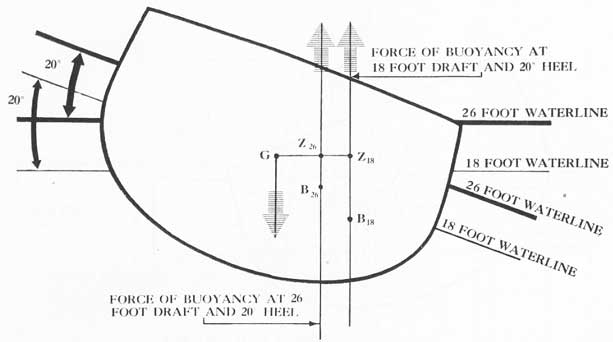
Figure 4-4. Diagram to show the effect of increased draft upon righting arm at a given angle of heel.
4-4. Righting arms and freeboard. A change of displacement will result in a change of draft and freeboard, causing the center of buoyancy to shift to a different location for any one given angle of inclination. At any angle except 0°, a variation in draft causes B to shift both horizontally and vertically with respect to the water level. The horizontal shift in B changes the righting arm, GZ. As shown in figure 4-4, the change in GZ at a specified angle will be a reduction if the change of draft is an increase. In other words, as freeboard is lost, righting arms throughout the range of stability are reduced. The ship in figure 4-4 is inclined at a given angle (20°). For the 18-foot draft the center of buoyancy is at B18 and the righting arm is GZ18. When the draft is increased to 26 feet, the center of buoyancy is at B20, which reduces the righting arm to GZ26.
When weight is added to a ship, displacement and draft are increased at the expense of reserve buoyancy and freeboard. One result of this is a reduction in righting arms as shown in figure 4-4. Another result is a change in righting moments due to increasing W in the expression: righting moment = W X GZ. Although both of these variations always occur simultaneously, they are due to independent causes, and must be considered separately. The gain in W does not necessarily compensate for the loss in GZ when weight is increased.
In order to avoid confusion in ensuing discussions these two separate results of a weight increase will be referred to as:
1. Increased moments due to gain in displacement.
2. Decreased righting arms due to loss of freeboard.
There is a third factor to be considered later, which usually follows a change in displacement; namely, a shift in the center of gravity.
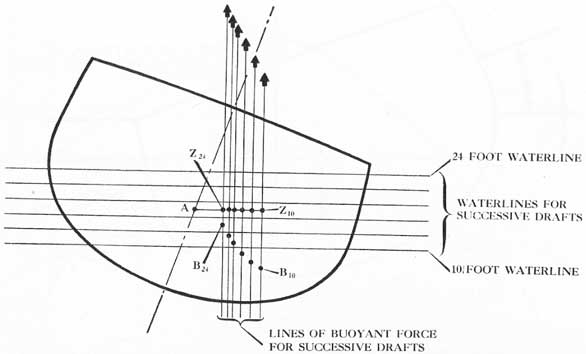
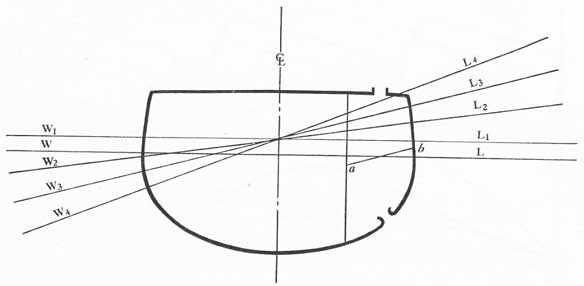
4-5. The cross-curves of stability. The design activity inclines the line drawing of the ship at a given angle, and then draws on it a series of waterlines. These waterlines are chosen at evenly spaced drafts throughout the probable range of displacements. With each waterline inclined at the given angle, the center of buoyancy for this waterline can be located by graphic means, as well as the line of action of the buoyant force. The center of gravity of the ship is assumed at a fixed point called the axis, and the righting arm is now the perpendicular distance from the axis to the buoyant force.
Figure 4-5 depicts the midship section of a ship inclined at a fixed angle, with the axis assumed at point A. The lines of buoyant force are sketched in for successive drafts. It is evident that the righting arm successively decreases as freeboard is lost, ranging from AZ10 at the 10-foot waterline down to AZ24 at the 24-foot waterline. The actual determination of AZ in the drafting room involves complicated graphic
40
Figure 4-5. Diagram to show a series of righting arms corresponding to successive drafts.
or mathematical methods which take into account the changing shape of the hull throughout the ship's length.
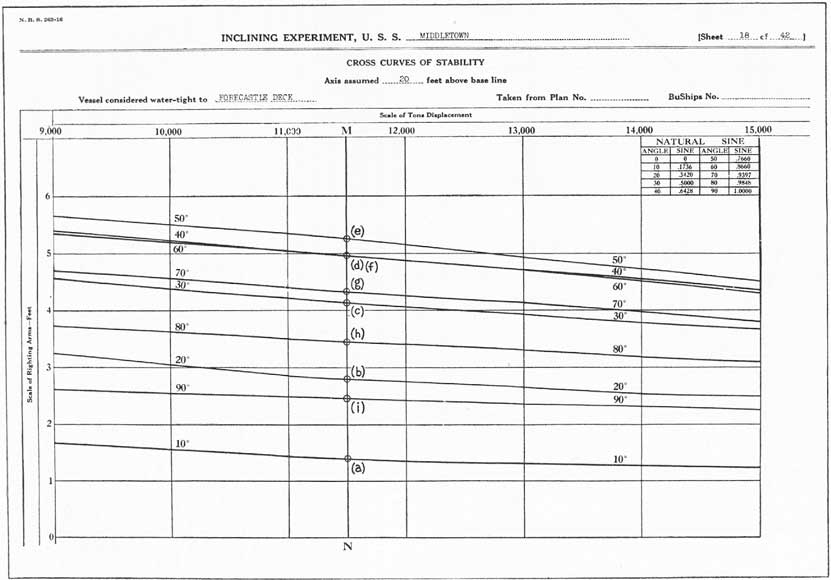
In this manner, a series of righting arms for successive drafts are obtained. For each inclination chosen, a curve is plotted of righting arms measured vertically against tons displacement measured horizontally. Values of displacement in the horizontal scale are chosen to correspond to the drafts used in obtaining the righting arms. The curve of righting arms versus displacement is known as a cross-curve of stability. It is customary to plot a cross-curve for 10°, another for 20°, another for 30°, and so on by 10° intervals to 90°, as shown in figure 4-6.
Plotting all the cross-curves to the same scale on one sheet facilitates their use in obtaining stability curves, as described in Article 4-6. The entire set of cross-curves is based upon the assumption that the ship's center of gravity lies in the centerline plane and is located at point A. The axis A is chosen at a round number of feet above the keel, and for reasons to be demonstrated later, is usually chosen below any actual location of G for the conditions of loading in which the ship is to operate.
It is noteworthy that the Z end of AZ is accurately and correctly determined in the cross-curves, but that
the A end is an assumed, rather than an actual point. Correction for this assumption will be discussed later.
4-6. Making use of the cross-curves. The cross curves are used for the purpose of finding a curve of stability for the ship at any required displacement. This is done by drawing a vertical line on the cross-curve sheet at the given displacement. At the intersection of this line with the 10° cross-curve, read the value of the righting arm (on the scale at the left in fig. 4-6). Plot this righting arm at 10° on the grid of the proposed stability curve. Repeat the process for 20°, 30°, etc., until a series of 9 points is plotted on the grid. Now fair a smooth line through these points from 0° to 90°, forming the required curve of stability.
For example, suppose that a stability curve for 11,500 tons displacement is to be taken from the cross-curves of U.S.S. MIDDLETOWN, and plotted on the grid in figure 4-7. First, draw a vertical line, MN in figure 4-6, at 11,500 tons. At point (a) on this line the righting arm is found to be 1.4 feet, as read on the scale at the left. Plot 1.4 at 10°, establishing point (a) on figure 4-7. Now find the righting arm at point (b) in figure 4-6, as 2.8, and plot this value at 20° to establish point (b) in figure 4-7. In this manner points (a) through (i) are obtained in figure 4-7, and they correspond to points (a) through (i)
41
Figure 4-6. Cross-curves of stability.
42
Figure 4-7. An uncorrected stability curve taken from the cross-curves.
respectively, in figure 4-6. The curve of stability is completed in figure 4-7 by drawing a smooth line through the points plotted.
Any stability curve that is taken from the cross-curves in the above manner is said to be "uncorrected;" that is, not corrected for the actual height of the ship's center of gravity above the keel. It does, however, embody the effect on righting arm of the freeboard for a given position of the center of gravity. The method of correction for KG, the actual height of G above the base line, is presented in Article 6-4.
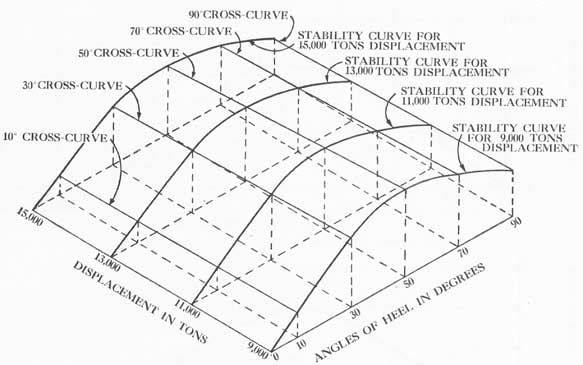
A comparison of cross-curves and stability curves is effected in the three-dimensional representation of a surface obtained by plotting displacements in one dimension, angles of heel in a second, and righting arms in the third dimension as shown in figure 4-8.
The two types of curves may be compared as follows:
1. On cross-curves:
Vertical values are righting arms.
Horizontal values are displacements.
Successive curves are for different angles of heel.
2. On stability curves:
Vertical values are righting arms.
Horizontal values are angles of heel.
Successive curves are for different displacements.
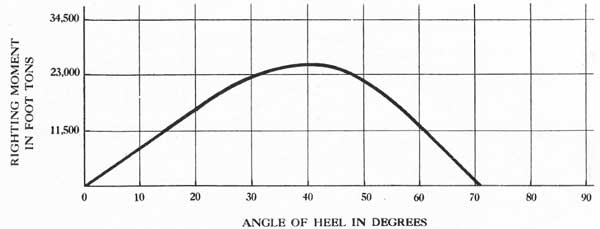
4-7. Righting moment curves. In Article 4-3 the curve of stability was introduced as a graph depicting righting arms at various angles of heel. This stability curve can be obtained from the cross-curves if the vessel's draft is known, and then must be corrected for the proper location of G. The latter correction is to be discussed later; assume for the present that it has been made. The result is a diagram on which any vertical distance from the base (or horizontal scale) to the curve is a righting arm. If this righting arm is multiplied by W (displacement) the product is the righting moment at that angle of heel. It is possible, therefore, to multiply all the verticals of the GZ curve by W, and thus obtain a series of righting moments. These can, in turn, be plotted on a grid to form a curve of righting moments, in which case the vertical scale at the left is graduated in foot-tons instead of feet. Figure 4-9 is a curve of righting moments obtained by multiplying the verticals of figure 4-2 by displacement and then plotting the results to a scale of foot-tons.
A more simple method than re-plotting can be used to convert any curve of righting arms to a curve of righting moments. Merely multiply each figure in the scale at the left by the proper value of displacement.
43
Figure 4-8. Isometric projection of cross-curves and curves of stability showing relationship (20°, 40°, 60° and 80° cross-curves have been omitted). Note that the vertical scale represents righting arm in feet for the example used. Height of axis above keel is 20 feet.
Figure 4-9. Curve of righting moments.
Figure 4-10 is a righting-moment curve obtained by changing the scale of figure 4-2.
WARNING: if two or more GZ curves for different displacements are plotted on the same grid, they can NOT be converted to a group of righting-moment curves by changing the scale at the left. In such a case, it is necessary to choose a new scale of foot tons and replot all the curves, multiplying each of them by its own proper displacement.
A curve of static stability is either a curve of righting
arms or righting moments, depending upon the scale units to which it is plotted or which are used in reading it. This is true only of individual curves, however, and not of groups of curves for different displacements.
4-8. Features of a stability curve. To find the righting moment (or arm) at a given angle of heel on the stability curve, enter the horizontal scale at the required angle, proceed vertically upward to the curve, and then proceed horizontally and read the righting moment
44
Figure 4-10. Curve of righting moments obtained by changing the scale of figure 4-2.
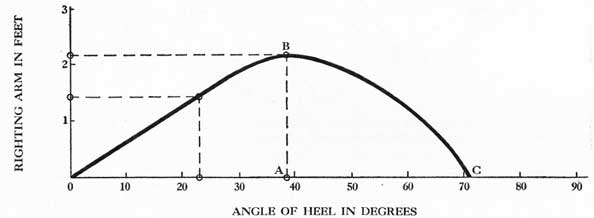
Figure 4-11. Properties of a stability curve.
(or arm) on the vertical scale at the left. If it is a scale of arms in feet, and the moment is desired, multiply the arm by tons displacement.
Thus, in figure 4-11, the righting arm at 23° is found to be 1.4 feet. Since displacement for that particular curve is 11,500 tons, the righting moment at 23° heel is 11,500 X 1.4 or 16,100 foot tons. Inspection of the figure will show that the maximum value of the righting arm is (in this case) about 2.2 feet, and that it occurs at an angle of approximately 38°. Multiplying by displacement, the maximum righting moment is found to be 11,500 X 2.2, or approximately 25,300 foot tons. Further, the ship has a positive righting moment for all angles up to 71°. This angle at which the righting moment becomes zero is known as the angle of vanishing stability, and we say that the ship has a range of stability of from 0° to 71°. If she rolls beyond 71° in calm water the ship will capsize.
Three important properties of any curve of stability are now evident (see fig. 4-11):
1. The maximum righting moment (or arm), AB.
2. The angle at which the maximum righting moment (or arm) occurs, A.
3. The range of stability, 0C.
The curves of stability thus far presented apply only to the intact ship; their properties affect the ship's rolling characteristics, but do not apply to a vessel which has taken on a permanent list. The latter case is to be dealt with later.
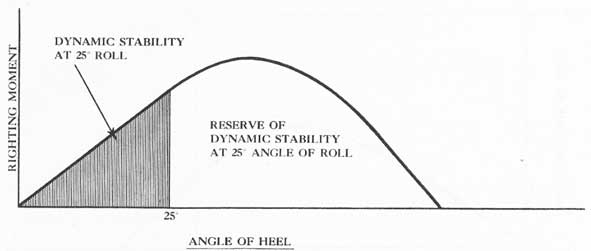
4-9. Dynamic stability.Dynamic stability is defined as the amount of work done in inclining a ship to a given angle. This work is done against the righting moment, and is done by some type of inclining moment. From physics we know that work is equal to moment times the angle through which the moment acts. Inspection of a righting-moment curve shows that any area on it represents work, since an area on the graph is a moment (measured vertically) times an angle (measured horizontally). Furthermore, the area under the curve up to any angle of heel represents the work done in inclining the ship to that angle of
45
Figure 4-12. The shaded area represents work done in inclining the ship 25°; it also represents dynamic stability when inclined at this angle.
Figure 4-13. The shaded area represents total dynamic stability.
heel, as indicated by the darker area in figure 4-12, and therefore this area represents the dynamic stability at the given angle (25° in the example).
When the rolling ship passes through a specified angle of heel, (such as 25° in the example) the dynamic stability represented by the shaded area also represents the amount of energy that was stored in the vessel in process of inclining it from an even keel to the given angle, and this energy will be available to return the ship to an even keel after the cause of the inclination is removed.
The total dynamic stability is the total amount of work that would have to be done on a ship to capsize it, and is therefore represented by the area under the righting-moment curve for the entire range of stability, as indicated by the shaded area shown in figure 4-13.
If the scale of degrees were converted to angles in
radians, a planimeter could be used to measure the area under the curve, thus actually determining dynamic stability as a measurement in tons-feet However, it is more useful not to obtain dynamic stability as a numerical figure, but rather to compare the areas under two curves for the ship in different conditions. Such a comparison provides a means, for example, of observing the relative resistance to capsizing before and after damage, in terms of the work required to overturn the ship. Total dynamic stability is therefore one index to the safety of the ship.
Since any stability curve can he converted to a righting-moment curve by multiplying every ordinate by the displacement for which it was plotted, it is also possible to regard areas under the righting-arm curve as indicative of dynamic stability, in a similar manner to that described above for righting-moment curves.
46
Figure 4-14.
In comparing two curves for a ship in widely different conditions of displacement, however, the areas under the righting-arm curve are only roughly indicative of the relative amounts of dynamic stability. If each set of GZ values is multiplied by its proper W in such a case, and then two curves of righting moment plotted on the same grid, the comparison is accurate.
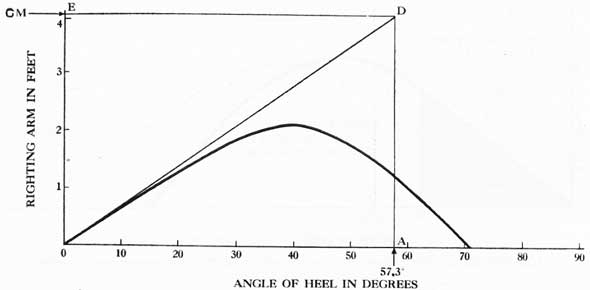
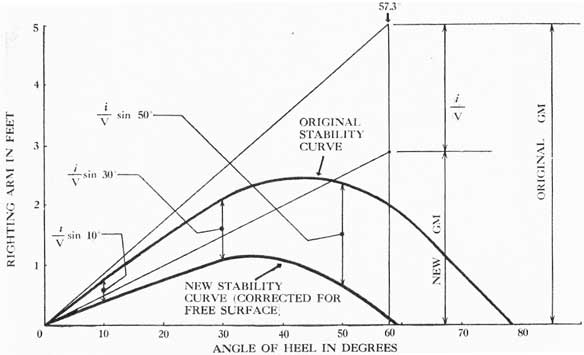
4-10. Finding GM on a stability curve. The direction in which the curve starts out from the origin depends on GM. If GM is large the curve is steep; if GM is small the curve starts out flat. To determine GM from a righting-arm curve, draw a tangent to the curve at the origin, and a vertical line at 57.3° angle of heel. The height of the intersection of these two lines is the value of GM and may be read on the righting-arm scale.
To find the GM of the curve in figure 4-14:
1. Draw a tangent to the curve at the origin (OD).
2. Erect a vertical line at 57.3° (AD).
3. Read GM (4.1 feet) on righting-arm scale (E).
In using this method of finding GM on a curve of righting moments, it is necessary to convert the scale at the left to righting arms.
4-11. Stability characteristics. The term stability characteristics embraces all factors which define the ship's transverse stability. The factors which constitute the stability characteristics can be found on that curve of stability which applies to the condition in which the ship is operating. These factors are:
1. Metacentric height (GM).
2. Maximum righting arm (moment).
3. Angle at which maximum righting arm (moment) develops.
4. Range of stability.
5. Total dynamic stability.
All the properties of the stability curve are interrelated. It is difficult to alter one of the above factors without affecting all the others, yet no one of them in itself serves as a complete criterion of stability. Rather, it is necessary to have a composite of the five factors listed above as a general index of the ship's ability to resist capsizing.
4-12. Properties that influence stability characteristics. There are certain properties of a ship, and of the loading within the ship, which if altered, produce a change in stability characteristics. These properties are:
1. Draft (displacement, freeboard).
2. Vertical height of ship's center of gravity.
3. Athwartship location of the center of gravity.
4. Free surface effect.
5. Free communication effect.
6. Trim.
The effects of draft, (displacement or freeboard) have been discussed in this Chapter. The effect of the vertical height and athwartship location of the center of gravity will be analyzed in Chapters VI and VII. Chapter VIII will be concerned with free surface and free communication effects of liquids within the ship. In Chapter X, the influence of trim on transverse stability will he discussed briefly. Finally, specific cases summarizing all seven characteristics will be analyzed under the subject of "Impaired Stability" in Chapter XIII.
47
CHAPTER V
THE INCLINING EXPERIMENT
5-1. Foreword. It was noted in previous chapters that the vertical location of the center of gravity must be known in order to determine the stability characteristics of a ship. This information about G is needed
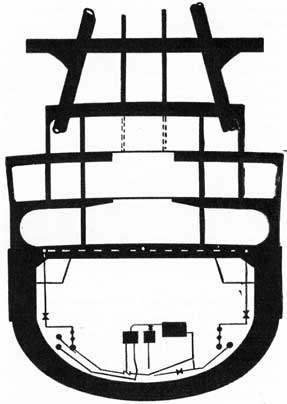
Figure 5-1. Diagrammatical cross section of a ship. Note that weights at various levels complicate the problem of calculating the vertical height of G, because it is difficult to locate centers of gravity of the individual weights.
both when the ship is in the design phase, and after it is completed. The designer must forecast the position of G in order to provide the ship with adequate stability.
5-2. Finding the center of gravity of ships in the design stage. The designer uses calculations to
determine the vertical position of the center of gravity. From available plans and data, the various items that go to make up the ship and its load are tabulated. The ship can be considered as consisting of the various parts of the structure, machinery and equipment. The load comprises fuel oil, water, ammunition and sundry stores aboard. The weight and location of these various items are either known by experience, or are estimated with some degree of accuracy. The weight location of electrical wiring, drainage piping, or of any of the other complex systems aboard, however, is not subject to easy and precise estimate.
Using the best available data, the vertical position of G is calculated by totaling the weight and vertical moments of the various items concerned. The sum of the moments divided by the total weight of the ship gives the vertical position of G.
Since it is necessary to estimate many of the weights and their locations, the value obtained is only approximate. Moreover, as the ship progresses through the different stages of design and construction, alterations of various magnitudes further reduce the accuracy of the calculation. Nevertheless, this approximate determination of G is necessary; limitations to its use are realized by the designers.
5-3. Necessity for the inclining experiment. Although the position of the center of gravity as estimated by calculation is sufficient for design purposes, an accurate determination thereof is requisite to computation of the ship's stability. Therefore, an inclining experiment is performed to obtain a precise measurement of KG, the vertical height of G above the keel (base line).
The inclining experiment actually measures meta-centric height (GM) accurately. But if the ship's draft is known, KM can be found on one of the curves of form prepared from the ship's lines: the KM curve. The KG = KM - GM (see fig. 5-2A).
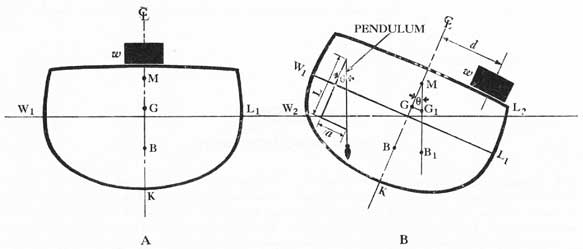
5-4. Performance of the inclining experiment. An inclining experiment consists of moving one or more large weights across the ship and measuring the angle
48
Figure 5-2. Diagram to indicate nature of the inclining experiment. rote how it, is shifted outboard in the right-hand sketch, and that θ represents angle of list.
of list produced. The metacentric height is calculated from the formula:
GM = (w X d) / ((W + w) X tan θ),
Where:
w = inclining weight in tons. d = distance weight moved athwartship in feet.
W = displacement of ship in tons.
θ = angle of list.
Tangent θ = a/L.
Certain preparations must be made in anticipation of the experiment. The Navy yard or building yard at which it is to be carried out issues a memorandum to the Commanding Officer of the ship outlining the necessary work to be done by ship's force and the yard in order to prepare the ship for inclining. The more important items are listed below:
1. Ship to have no list.
2. Ship to be brought to a condition of minimum trim.
3. Bilges to be dry.
4. Liquid in fuel-oil and water tanks to be in accordance with instructions of the memorandum.
5. Inventory of all consumables to be made by ship's force and inclining party.
Except for necessary watches, the ship's force is put ashore during the performance of the experiment. The inclining party does the actual work involved, and collects data for the calculations. If the ship has excessive trim during the inclining experiment, a correction for this factor is made before KG is computed.
A correction also must be made for any free surface existing in ship's tanks at the time of inclining (free surface effect correction is added to GM as found from the experiment).
5-5. Results of the inclining experiment. The KG obtained from the inclining experiment is accurate for the particular condition of loading that obtained when the ship was inclined. This is known as Condition I, or the as-inclined condition. The ship may have been in any condition of loading at the time of the experiment, and this may not have been an operating condition. In order to convert the data thus obtained to practical use, KG must be determined for operating conditions. The method employed in calculating KG for other conditions of loading is set forth in Chapter IX.
5-6. Accurate results and check experiments. The accuracy of data obtained in the inclining experiment depends, of course, upon complete and careful cooperation by members of the ship's force and the inclining party. Any indifference or lack of cooperation usually will give rise to undependable results.
A check, or unofficial inclining experiment, may subsequently be performed. The method for doing this is outlined in Appendix A. Such an experiment may also prove useful after damage that has resulted in flooding, or in cases involving heavy emergency topside loading.
5-7. Usefulness of the information obtained. Information obtained guides BuShips in decisions about proposed alterations, and in making recommendations as to loading and ballasting. It also provides data on the stability of a given vessel.
49
CHAPTER VI
WEIGHT SHIFTS AND TRANSVERSE STABILITY
6-1. Foreword. In the preceding Chapter on the Inclining Experiment, it was shown how the vertical height of the ship's center of gravity above the keel (base line) is determined. If the ship is floating upright at 0°, the center of gravity must lie in the ship's centerline plane. If G were not on the centerline, the vessel would have to list until the center of buoyancy (B) "moved over" and became located under G again. Thus, both the vertical and athwartship locations of G have been established. It is now proposed to show how a shift in the position of G, caused by moving weights in the ship, influences transverse stability. This chapter on weight shifts deals only with weights that are already on board; such weights constitute a part of the ship's loading both before and after a relocation is effected.
6-2. General effect of weight movement. If one weight in a system of weights is moved, the center of gravity of the whole system moves along a path parallel to the path of the component weight. Moreover, the distance that the center of gravity of the system moves may be calculated from the formula:
GG1 = ws / W.
Where:
w = component weight (tons). s = distance component weight is moved (feet).
W = weight of entire system (tons).
GG1 = shift in center of gravity of system (feet).
Weight movements in a ship can take place in three possible directions - athwartship, fore-and-aft, and vertically (perpendicular to the decks). The most general type of movement is, of course, inclined with respect to all three of these. Such a diagonal movement can be divided into components in each of the three directions; and one component can be studied at a time without reference to the others. For example, if a weight is to be moved from the hold on the starboard bow to the main deck on the port quarter, this movement may be regarded as taking place in three steps:
1. From hold to main deck.
2. From starboard to port side.
3. From bow to stern.
Throughout this text, reference to locations, directions, and movements are always made with respect to the ship, not with respect to space. Further, directions and measurements are based on even-keel conditions. For example, a "vertical" distance of seven feet means that the seven-foot distance is measured perpendicular to the base line. If it is stated that the depth of water in a compartment is four feet, the meaning is that if the ship were upright, with no list and no trim, the average depth of water in that compartment would measure four feet from surface to deck.
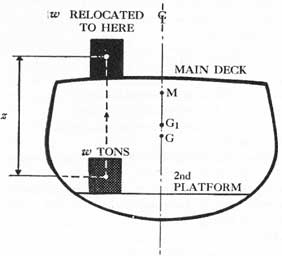
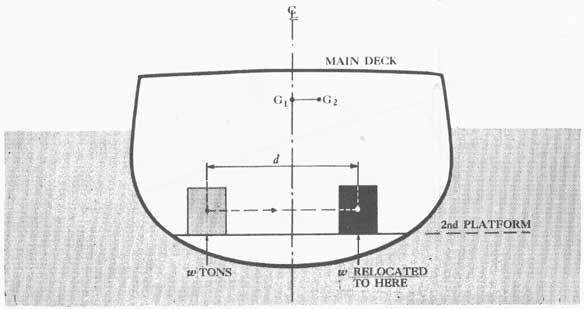
Figure 6-1. Diagram to show shift in G (G to G1) due to relocation of w.
Fore-and-aft weight shifts are discussed in Chapter X. It is now proposed to study how vertical and athwartship relocations of weight influence the transverse stability of the ship.
6-3. Vertical weight shifts. Assume that a weight of iv tons is moved straight up from the second
50
Figure 6-2. Diagram to show loss of righting arm when the center of gravity rises.
platform deck to the main deck, a vertical distance of z feet. As a result, the ship's center of gravity, G, will move straight up on the centerline (see fig. 6-1). The vertical rise in G can be computed from the formula:
GG1 = wz/W.
GG1 = vertical rise of G (feet). w = weight moved up (tons). z = vertical shift of w (feet).
W = displacement of ship (tons).
Problem 1:
The U.S.S. MIDDLETOWN is operating with a displacement of 11,500 tons. Her ammunition totals 670 tons. Find the rise in G if all ammunition is moved from the magazines to the main deck, a distance of 36 feet.
Answer:
GG1 = (670 X 36)/ 11,500 = 2.1 feet.
Moving a weight which is already aboard the ship will cause no change in displacement. Consequently, there can be no change in M, the metacenter. If M remains fixed, then the upward movement of the center of gravity results in a loss of metacentric height. Expressed mathematically:
GM = old metacentric height (feet).
GG1 = rise in the center of gravity (feet).
The terms "new" and "old" are used to indicate before the weight movement and after the weight movement respectively. With the weight now on the main deck, moving it down to the second platform would reverse the positions of G and G1. The shift in G would be found from the same formula as before, the only difference being that GG1 now becomes a gain in metacentric height, instead of a loss.
Problem 2:
If the U.S.S. MIDDLETOWN's GM was 3.7 feet before the weight was moved in problem 1, what is her GM afterward?
Answer:
G1M = 3.7 - 2.1 = 1.6 feet.
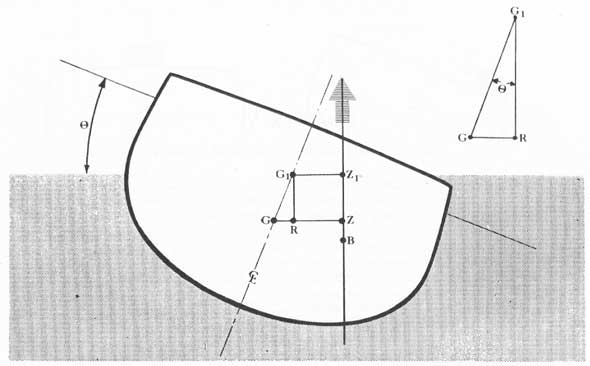
A vertical shift in the ship's center of gravity changes every righting arm throughout the entire range of stability. If the ship is at any angle of heel, such as θ in Figure 6-2, then the righting arm is GZ with the center of gravity at G. But if the center of gravity shifts to G1, the righting arm becomes G1Z1. And G1Z1 is smaller than GZ by an amount GR. In the right-triangle GRG1, the angle of heel is at G1, so that by trigonometry the loss of righting arm may be found from:
GR = GG1 X sin θ.
51
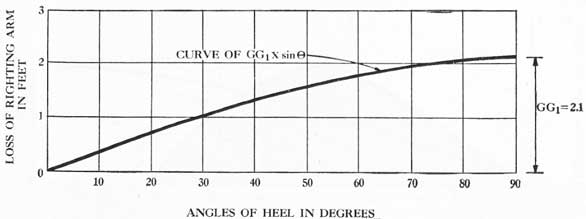
Figure 6-3. A sine curve to show loss of GZ at various angles of heel produced by moving a weight as in problem 1.
The expression GR = GG1 X sin θ may be expressed in plain words as "the loss of righting arm equals the rise in the center of gravity times the sine of the angle of heel." The sine of the angle of heel is a ratio which can be found by consulting a table of sines, an abbreviated sample of which is given below:
Angle
Sine
Angle
Sine
0°
0.000
50°
0.766
10°
0.174
60°
0.866
20°
0.342
70°
0.940
30°
0.500
80°
0.985
40°
0.643
90°
1.000
If the loss of GZ is found for 10°, 20°, 30°, and so on, by multiplying GG1 by the sine of the proper angle as taken from the table, a curve of loss of righting arms can be obtained by plotting values of GG1 X sin θ vertically against angles of heel horizontally. The result is a sine curve, which resembles figure 6-3. It starts with a zero value at 0°, slopes upward, then levels off near its maximum value which occurs at 90°. At 30° a sine curve is always just half as high as it is at 90°.
Problem 3:
Construct a sine curve to show the loss of GZ at various angles of heel produced by moving the weight in problem 1.
Answer:
GG1 = 2.1 feet, and values of GG1 sin θ are as shown in the table at the bottom of the page.
The required curve is obtained by plotting the values in the table on a grid, as shown in figure 6-3.
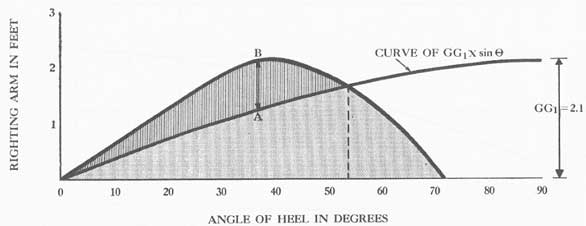
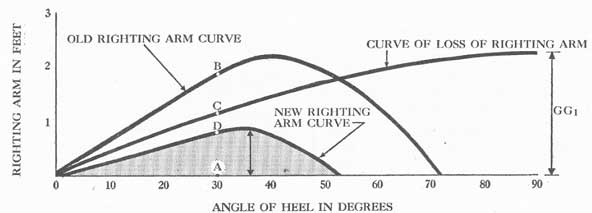
The sine curve may be superimposed on the original stability curve to show the effect on stability characteristics of moving the weight up in a ship. Inasmuch as displacement is unchanged, the righting arms of the old curve need be corrected for the change of G only, and no other variation occurs. Consequently if GG1 X sin θ is deducted from each GZ on the old stability curve, the result will be a correct righting-arm curve for the ship after the weight movement.
In figure 6-4, the sine curve has been superimposed on the original stability curve. The dotted area is that portion of the curve which was lost due to moving weight up, whereas the lined area is the remaining or residual portion of the curve. The residual maximum righting arm is AB, about 0.8 feet, and occurs at an angle of about 37°. The new range of stability is from 0° to 53°.
The reduced stability of the new curve becomes more evident if the intercepted distances between the old GZ curve and the sine curve are transferred down to the base, thus forming the new curve of static stability. This has been done in figure 6-5, where, for example, the old righting arm at 30° was AB,
Angle
Loss of GZ
Angle
Loss of GZ
0°
2.1 X 0 =0.00
50°
2.1 X .766 = 1.61
10°
2.1 X .174 = 0.37
60°
2.1 X .866 = 1.82
20°
2.1 X .342 = 0.72
70°
2.1 X .940 = 1.97
30°
2.1 X .500 = 1.05
80°
2.1 X .985 = 2.07
40°
2.1 X .643 = 1.35
90°
2.1 X 1.00 = 2.1
52
Figure 6-4. Example of a sine curve superimposed on the original stability curve.
Figure 6-5.
but has lost AC. The new righting arm has a value of CB, which is plotted up from the base to locate point D (CB = AD), and thus establish a point at 30° on the new stability curve. A series of points thus obtained by transferring intercepted distances down to the base delineates the new curve. Numerical values in figure 6-5 show the effect on U.S.S. MIDDLETOWN's curve of moving the weight in problem 1. The residual stability may be analyzed on the new curve as follows:
1. GM is 1.6 feet.
2. Maximum righting arm is 0.8 feet.
3. Angle of maximum righting arm is 37°.
4. Range of stability is from 0° to 53°.
5. Total dynamic stability is represented by the dotted area.
6-4. Correction of a stability curve from the cross-curves. The cross-curves are based on a center of gravity assumed at point A, the axis. The operating ship will have varying conditions of loading, each of which
will not only differ in displacement but will have a new height of G. The new displacement requires selecting a new stability curve from the cross-curves. The new height of G above the baseline (KG) requires correcting the curve. The shift of the ship's center of gravity from the assumed point A to the actual point G is equivalent to the effect of a vertical weight movement.
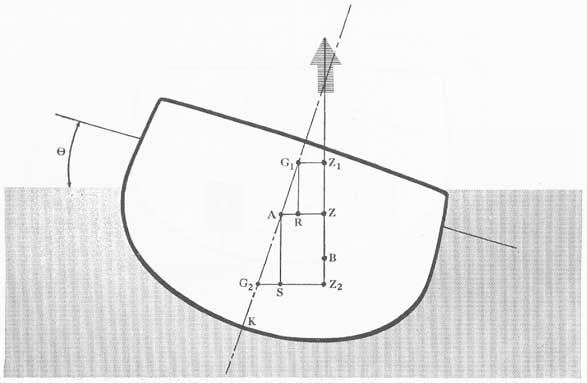
Figure 6-6 depicts a ship at an angle of heel, with the axis at point A. If the ship's center of gravity were located at A, the righting arm would be AZ. But G is more likely to be above A, since the axis is deliberately chosen at a low point. If the center of gravity is at G1 the righting arm is G1Z1, which is smaller than AZ by an amount AR. But, as in Article 6-3, AR = AG1 X sin θ. Therefore, to correct the stability curve deduct AG1 X sine θ from every righting arm. If the actual location of G is below A, however, such as at point G2, then AG2 X sin θ will be added to the righting arms in the cross-curves.
53
Figure 6-6.
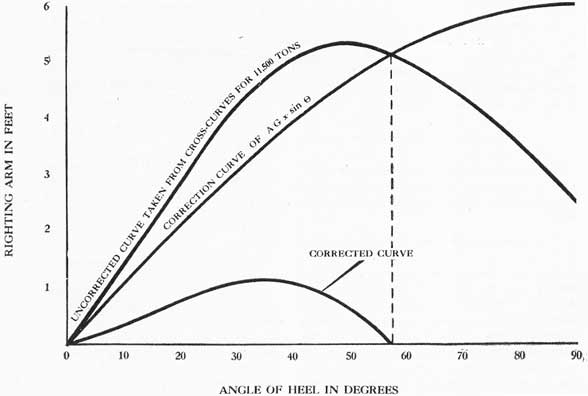
Figure 6-7. Diagram to illustrate correction of a stability curve taken from the cross-curves.
54
Figure 6-8. Diagram illustrating movement of GI corresponding to athwartship relocation of w.
Problem 4:
The U.S.S. MIDDLETOWN is operating with a mean draft of 19 feet 6 inches and KG is 26 feet. Obtain the stability curve by taking a curve from the cross-curves and correcting it.
Answer:
The curve is obtained exactly as in Chapter IV for figure 4-7, since the 19 foot 6 inch draft corresponds to a displacement of 11,500 tons. This curve is shown in figure 6-7, and then corrected (correction curve) by deducting AG sin θ at 10°, 20°, 30°, and so on. The final result is shown as the "corrected curve."
AG = KG - KA = 26 feet - 20 feet = 6 feet.
AG sin θ for 30° = 6 X 0.50 = 3 feet, etc.
The corrected righting-arm curve can now be multiplied by displacement to produce a proper curve of righting moments for the operating condition of the vessel.
6-5. Horizontal weight shifts. If the ship is upright, G lies in the fore-and-aft centerline, and all weights on board are balanced. Now move any weight horizontally across the deck in an athwartship direction. As a result G shifts in an athwartship direction, parallel to the weight movement. B and G are now no longer in the same vertical line, and an upsetting moment exists at zero inclination. This causes the ship to heel until B moves under the new position of G. The ship will list to the angle where B is vertically under G, and in calm water the ship remains at this
angle. But if the ship is in a seaway it will roll about the angle of permanent list.
Assume that a weight of w tons is moved athwart-ship across a given deck a horizontal distance of d feet. As a result, the ship's center of gravity will move straight athwartship (see fig. 6-8). The horizontal shift in G can be computed from the formula:
G1G2 = wd/W.
Where:
G1G2 = athwartship shift of G (feet). w = weight moved over (tons). d = distance w moves (feet).
W = displacement of ship (tons).
Problem 5:
The U.S.S. MIDDLETOWN is operating with a displacement of 11,500 tons. One hundred and eighty-five tons of stores are shifted from port to starboard on the second deck, a horizontal distance of 56 feet. Find the athwartship movement of G.
Answer:
G1G2 = (185 X 56) / 11,500 = 0.90 feet.
The ship in figure 6-9 has had its center of gravity pulled off-center by an athwartship weight movement, from G1 to G2. If the center of gravity were at G1, the righting arm would be G1Z1, as found for this angle and displacement from the cross-curves, and as corrected for the actual vertical height of G. But when the center of gravity is moved to G2, the righting arm is thereby reduced to a residual value of
55
Figure 6-9. Diagram to illustrate loss of righting arm when the center of gravity is moved off the centerline.
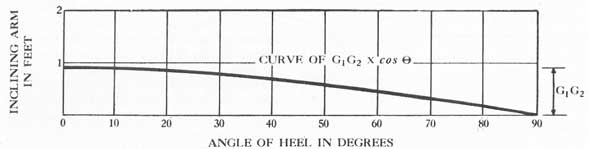
Figure 6-10. A cosine curve.
G2Z2. Inspection of the figure will indicate that G2Z2 is smaller than G1Z1 by an amount of G1T. The distance G1T is equal, however, to G1G2 X cos θ by trigonometry, since in the right-triangle G1TG2 the angle of heel is at G1. Thus, the loss of righting arm involved in an athwartship movement of G is equal at any angle of heel to G1G2 X cos θ. This variable distance G1G2 X cos θ is called the ship's inclining arm. If the inclining arm is multiplied by displacement (W), the product is the ship's inclining moment.
The expression G1T = G1G2 X cos θ may be expressed in plain words as "the inclining arm is equal to the athwartship shift in the center of gravity times the cosine of the angle of heel." The cosine of the angle of heel is a ratio which can be found by
consulting a table of cosines, an abbreviated sample of which is given below:
Angle
Cosine
Angle
Cosine
0°
1.000
50°
0.643
10°
0.985
60°
0.500
20°
0.940
70°
0.342
30°
0.866
80°
0.174
40°
0.766
90°
0.000
If the inclining arm is computed for 10°, 20,° 30°, and so on, by multiplying G1G2 by the cosine of the proper angle as taken from the table, a curve of inclining arms can be obtained by plotting values of G1G2 X cos θ vertically against angles of heel horizontally. The result is a cosine curve which
56
Figure 6-11. A cosine curve superimposed on the original stability curve.
resembles figure 6-10. It starts with a maximum value at 0°, curves downward, and becomes zero at 90°. At 60° the cosine curve is just half as high as it is at 0°. Note that the cosine curve is just the opposite of the sine curve, and is otherwise identical in shape.
Problem 6:
Construct a cosine curve to show the inclining arm at various angles of heel produced by moving the weight in problem 5.
Answer:
G1G2 is 0.90 feet, and values of G1G2 X cos θ at various angles of heel are as follows:
Angle
Inclining Arm
0°
0.9 X 1.000 = 0.90
10°
0.9 X 0.985 = 0.89
20°
0.9 X 0.940 = 0.85
30°
0.9 X 0.866 = 0.78
40°
0.9 X 0.766 = 0.69
50°
0.9 X 0.643 = 0.58
60°
0.9 X 0.500 = 0.45
70°
0.9 X 0.342 = 0.31
80°
0.9 X 0.174 = 0.16
90°
0.9 X 0.0000 = 0.00
The required curve is obtained by plotting the above points on a grid, as shown in figure 6-10.
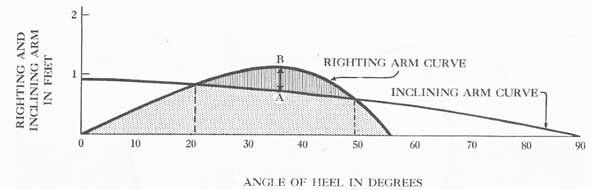
Just as the sine curve was superimposed on the GZ curve, so may the cosine curve be superimposed on the stability curve to show the effect on stability of moving a weight athwartship. The righting-arm curve on which the inclining-arm curve is to be placed should be correct as to displacement (freeboard) and actual height of the center of gravity. If a stability curve for the condition prior to the horizontal weight movement is thus chosen, it need only be corrected for the horizontal shift of G, since no other change occurs in a horizontal weight movement. Consequently,
deducting G1G2 X cos θ from each GZ on the old curve will produce a correct new curve.
In figure 6-11, the cosine curve has been superimposed on the original stability curve. The dotted area is that portion of the curve which was lost due to the weight shift, whereas the lined area is the remaining or "residual" portion of the curve. The residual maximum righting arm is AB, about 0.4 feet, and develops at an angle of 37°. The new range of stability is from 20° to 50°.
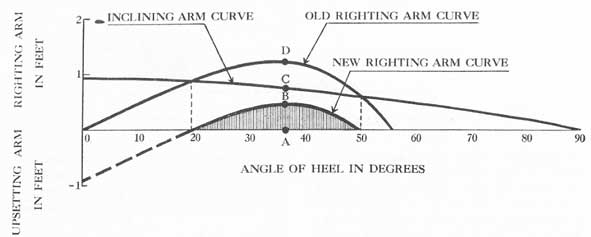
The new curve of static stability can be plotted on the base by transferring down the intercepted distances between the cosine curve and the old GZ curve. In figure 6-12, this has been done. For example, the old righting arm at 37° was AD, the loss of righting arm (inclining arm) at this angle is AC, leaving a residual GZ of CD. This residual value, CD, has been plotted up from the base as AB to provide one point on the final curve. A series of points are obtained in like manner, establishing the curve of residual righting arms on the base of the grid. Numerical values in figure 6-12 show the effect on U.S.S. MIDDLETOWN's curve of moving the weight athwart-ship in problem 5. The residual stability may be analyzed on the new curve as follows:
1. Maximum righting arm is 0.4 feet.
2. Angle of maximum righting arm is 37°.
3. Range of stability is from 20° to 50°.
4. Total dynamic stability is represented by lined area.
The ship of figure 6-12 will have a permanent list at an angle of 20°, which is the angle where B is under G, inclining arm equals original righting arm, cosine curve crosses original GZ curve, and residual righting arm is zero. If every vertical distance on the diagrams in the figure is multiplied by
57
Figure 6-12.
Figure 6-13
displacement (W) the righting-arm curves become righting-moment curves, and the inclining-arm curve becomes an inclining-moment curve.
In a seaway the ship will roll about its angle of list. If it rolls farther to the listed side, a righting moment develops which tends to return it toward the angle of list. If it rolls back toward the upright, an upsetting moment develops which tends to return it toward the angle of permanent list. The upsetting moment (between 0° and the angle of list) is the difference between the inclining and righting moments.
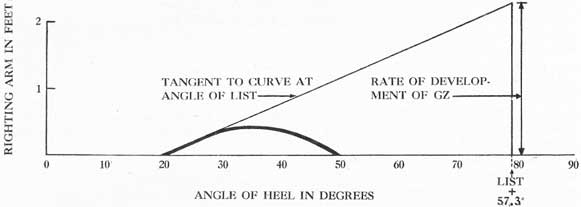
Although GM does not change for off-center weight movements, there is an interesting property of the stability curve which might be described as the "rate of development of GZ" at the angle of equilibrium (list). It is measured by the slope of the residual curve at the angle of list. This slope can be found by drawing a tangent to the new GZ curve at the angle of permanent list, and erecting a perpendicular to the horizontal scale at the angle of list plus 57.3°.
The point of intersection of the tangent with the perpendicular is located, and its height above the base measured (to the scale of righting arms), which height is the "rate of development of GZ" (see fig. 6-13).
6-6. Diagonal weight shifts. A weight may be shifted diagonally, so that it moves up or down and athwartship at the same time. Or such a shift may be accomplished by moving a weight up or down, and then moving it athwartship. A similar effect can be attained by moving one weight vertically and moving another weight horizontally.
When such a diagonal shift takes place, it should be treated in two steps. First, find the effect on GM and stability characteristics of the vertical component of the movement, using the methods described in Articles 6-3 and 6-4. Second, on the results of the first step, find the effect of the horizontal component of the movement. The second step uses the methods of Article 6-5 to analyze the effect on stability of the athwartship component.
58
CHAPTER VII
WEIGHT CHANGES AND TRANSVERSE STABILITY
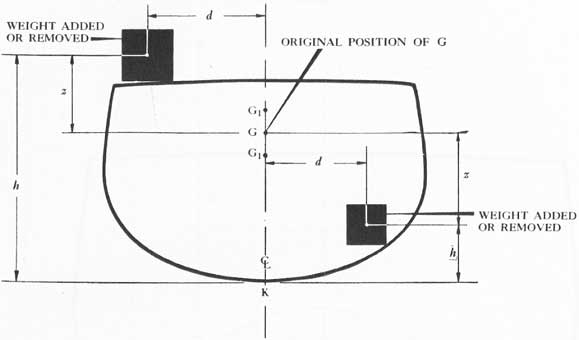
7-1. Foreword. The addition or removal of weight anywhere in a ship will affect draft, list, trim and stability (weight removal reverses the effect of addition). In determining various effects it is convenient to regard the weight as being added to the ship through a series of steps. Regardless of its true position, the object added can be considered to have been placed first in the center of the ship, then moved up (or down) to its final height, next moved outboard to its final off-center location, and ultimately shifted forward (or aft) to its true position. This Chapter is concerned only with transverse stability; hence, the final fore-and-aft movement has been omitted here. It is discussed in Chapter X.
The following discussion begins by assuming that a weight is added to the ship in such location that the ship will not heel or change trim. To achieve this the weight must be placed somewhere on a vertical line through the center of flotation, which is the center of area of the waterline plane at which the ship is floating. For practical purposes, it is also assumed that the weight is added in the ship's centerline plane, and at the height of the ship's center of gravity, so that G will not shift horizontally or vertically.
7-2. New draft and displacement. Let us assume that the added weight is on board (in vertical line with the center of flotation) and at the height of the ship's present center of gravity. Step one is to find the new displacement, which is the old displacement plus the added weight.
New displacement = (W + w) tons.
Where:
W = old displacement (tons).
w = added weight (tons).
Step two is to find the new mean draft. Enter the curves of form with the new value of displacement, and on the displacement curve find the corresponding draft. This is the new mean draft.
We should note that steps one and two may be reversed, provided the change of draft is not over about one foot, In this case, find tons per inch immersion from the curves of form (see Art. 11-5) for the old mean draft. Divide the added weight (in tons) by
the tons per inch in order to get the bodily sinkage in inches. Add this bodily sinkage to the old mean draft to get the new mean draft. Now use the latter to enter the curves of form and find the new displacement.
Whenever draft is required in the computations that follow, use the new mean draft, and for any operation requiring displacement, the new value (W w). 7-3. Effect of vertical location: new GM and curve. In Article 7-2, the weight was added at the height of G above the keel so as not to pull G up or down. Now assume that the weight is moved vertically on the ship's centerline to its final height above the keel. This movement will cause G to shift up or down (see fig. 7-1). The next step, (step three), is to compute the vertical shift of G. This can be done through the use of the following formula:
GG1 = wz / (W + w)
Where:
GG1 = shift of G up or down (feet).
w = added weight (tons).
z = vertical distance w is added above or below original location of G (feet).
(W + w) = new displacement (tons).
Step four is to find the new height of the ship's center of gravity above the keel. To do this the original height, KG, must be known.
KG1
= KG ± GG1.
Where:
KG1
= new height of G above keel (feet).
KG
= old height of G above keel (feet).
GG1
= shift of G from step three.
If the final position of the added weight is below the original position of G, then GG1 is minus; if it is above G, the value of GG1 in the formula is plus when applied to KG.
Step five is to find the new height of the meta-center above the keel. To do this enter the curves of form with the new mean draft, and find the height of transverse metacenter above the base line (see Art. 3-13) corresponding to the new draft. Designate this value as KM1.
59
Figure 7-1.
Step six provides the new metacentric height, which is the value of GM now effective and to be used henceforth.
G1M1
= KM1 - KG1.
Where:
G1M1
= new metacentric height (feet).
KM1
= new KM from step five.
KG1
= new KG from step four.
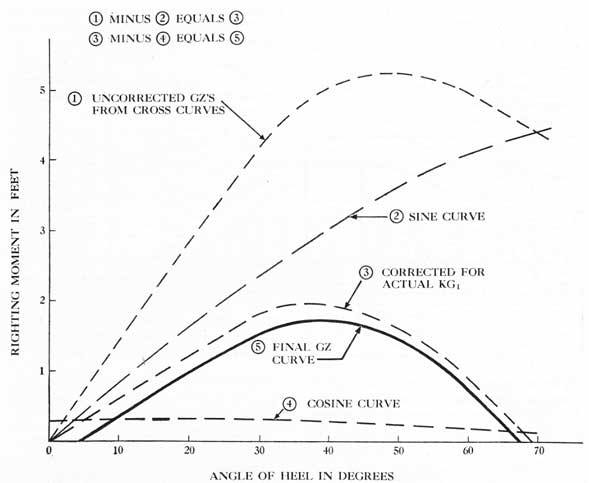
Step seven is to take a new uncorrected curve of stability from the cross-curves, as described in Article 4-6, using the new value of displacement, W + w.
Step eight requires correcting this curve for the new height of the ship's center of gravity above the base line (see Art. 6-4). To do this, find AG1 (which is KG1 minus KA), and subtract AG1 X sin θ from every vertical on the stability curve, provided G1 is above A, as it will be in most cases. However, if G1 is below A, then values of AG1 X sin θ must be added to the curve. The resulting curve of righting arms is now correct for the loss of freeboard due to the added weight, and for the final height of the ship's center of gravity resulting from the weight addition.
7-4. Effects of horizontal location: list and stability. In Articles 7-2 and 7-3 the weight was added in the ship's centerline and moved up or down to its final height. Now move the weight athwartship to its final off-center location (see fig. 7-1).
Step nine requires finding the athwartship shift of G, making use of the following formula:
G1G2 = wd / (W + w)
Where:
G1G2 = horizontal shift of G (feet). w = added weight (tons). d = distance added weight is moved off the ship's centerline (feet).
(W + w) = new displacement (tons).
Note: The foregoing formula may be rewritten in another form as:
(W + w) X G1G2 = wd.
The expression (W + w) X G1G2 is the inclining moment of the added weight, G1G2 being the inclining arm, as developed in Article 6-5. Therefore the inclining moment equals wd when the ship is upright.
Step ten is to superimpose a curve of inclining arms on the corrected stability curve which was obtained in step eight (see Art. 6-5). To do this, subtract G1G2 X cos θ from every righting arm on the stability curve, moving the residual values of GZ down to the base. The resulting curve of righting arms which is now plotted on the base or horizontal scale of the grid, is correct for freeboard, height of G, and off-center weights. It remains only to multiply the verticals of the curve by displacement to provide righting moments.
60
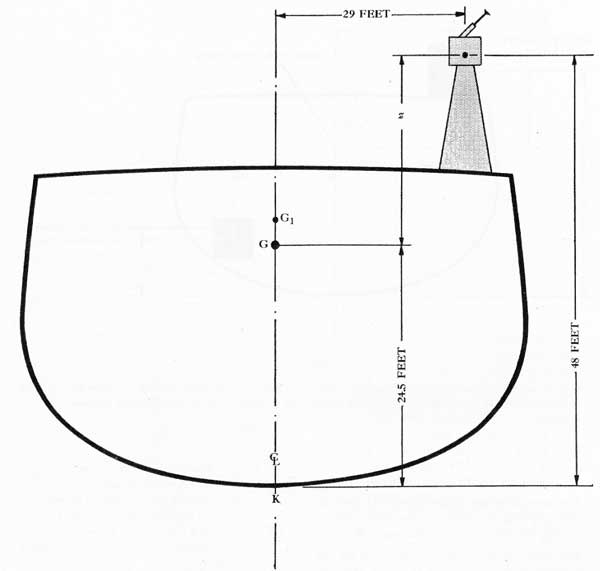
Figure 7-2. Diagram to show weight addition as per problem in Article 7-5.
Therefore, step eleven is to multiply the curve obtained in step ten by (W + w) to provide values of righting moment. This can be done easily by changing the scale at the left if the curve is alone on the grid. But if the final product is to be plotted with and compared with other stability curves for different displacements, the new curve must be replotted to some suitable scale of foot tons.
The angle of permanent list may be found (step twelve) as the angle on the horizontal scale at which the curve of residual righting moments begins. At this angle the righting arm as found in step eight is just equal to the inclining arm as found in step ten, G is vertically above B, and the ship is in equilibrium.
The angle of permanent list should agree with that read on the ship's clinometer.
If the angle of list involved is small (remaining under about 10°) , the list can be computed from the following formula:
tan θ = wd / ((W + w) G1M1).
Where:
w
= added weight (tons).
D
= distance w is off-center (feet).
(W + w)
= new displacement (tons).
G1M1
= new metacentric height, as found in step six (feet).
tan θ
= tangent of the angle of heel.
Once tan θ has been calculated, the angle of heel
61
Figure 7-3. Curve of righting arms as per step 10 in Article 7-5.
may be found by consulting a table of tangents. Or a quick method of approximating θ is to multiply tan θ by 57.3° (since the tangent of a small angle is approximately equal to the angle in radians). The latter method is only useful where the angle is under about 10°.
Step thirteen concludes the analysis by delineating those factors which constitute residual stability characteristics on the final stability curve, as found in step eleven.
7-5. Example of weight addition. Add four 40 mm. mounts topside on U.S.S. MIDDLETOWN. The mounts weigh 28 tons each, including structure, and their center of gravity is located 48 feet above the keel and 29 feet to starboard of the centerline. In the original condition, displacement was 11,500 tons and KG 24.50 feet. What is the effect on stability characteristics?
Step one:
New displacement = W + w = 11,500 (4 X 28) = 11,612 tons.
Step two:
New mean draft = 19.7 feet (from fig. 3-3).
Step three.
GG1 = wz / (W + w)
w = 4 X 28 = 112 tons. z = 48 - 24.5 = 23.5 feet.
GG1 = (112 X 23.5) / 11,612 = 0.23 feet.
The following values are taken from cross-curves for 11,612 tons displacement. KA is 20 feet, as shown in figure 4-6. Corrections are for AG, X sin θ = (24.73 - 20) X sin θ = 4.73 X sin θ.
Angle
Uncorrected Righting Arm
Correction
Corrected Righting Arm
0
0
0
0
10°
1.40
4.73 X.174 = 0.32
0.53
20°
2.82
4.73 X.342 = 1.62
1.20
30°
4.13
4.73 X.500 = 2.37
1.76
40°
4.96
4.73 X.643 = 3.05
1.91
50°
5.22
4.73 X.766 = 3.63
1.59
60°
4.96
4.73 X.866 = 4.10
0.86
70°
4.33
4.73 X.940 = 4.45
-0.12
The above points are plotted in figure 7-3 to provide a curve of righting arms, as required for step eight. Actual plotting could have been deferred, however, until after making the necessary correction for off-center weights
Step nine:
G1G2 = wd / (W + w) = (112 X 29) / 11,612 = 0.28 feet.
Step ten:
The righting arms from step eight are corrected below for G1G2 X cos θ = 0.28 X cos θ.
Angle
Upright Arm
Correction
Final Righting Arm
0°
0
.28 X 1.00 =.28
-0.28
13°
0.58
.28 X 0.985 =.28
0.30
20°
1.20
.28 X 0.940 =.26
0.94
30°
1.76
.28 X 0.866 =.24
1.52
40°
1.91
.28 X 0.766 =.21
1.70
50°
1.59
.28 X 0.643 =.18
1.41
60°
0.86
.28 X 0.500 =.14
0.72
70°
-0.12
.28 X 0.342 =.10
-0.22
The foregoing points are plotted in figure 7-3 to
provide a curve of righting arms, as required for step ten. Actual plotting could have been deferred, however, until after multiplying to obtain moments.
Step eleven:
To obtain a curve of righting moments, the righting arms found in step ten are multiplied by the new displacement, (W + w) = 11,612 tons.
Angle
Righting Arm
Righting Moment
0°
-0.28
-3,300
10°
0.30
3,500
20°
0.94
10,900
30°
1.52
17,700
40°
1.70
19,700
50°
1.41
16,400
60°
0.72
8,400
70°
-0.22
-2,600
The above series of values are plotted in figure 7-4 to provide the final curve of righting moments.
Step twelve:
tan θ = wd / (W + w)G1M1 = (112 X 29) / (11,612 X 3.7) = .075
0 =.075 X 57.3 = 4.3° approximate angle of list.
Step thirteen:
The stability characteristics of U.S.S. MIDDLETOWN after the addition of the gun mounts are as follows:
1. GM = 3.7 feet.
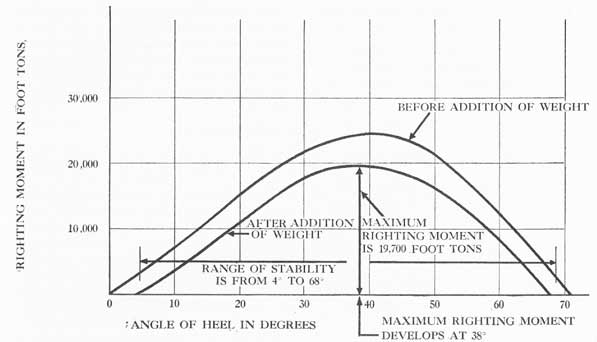
2. Maximum righting moment = 19,700 foot tons.
3. Maximum righting moment develops at 38°.
4. Range of stability is from 4° to 68°.
5. Total dynamic stability is represented by the area under the lower curve of figure 7-4.
The foregoing problem was presented to illustrate a principle rather than to describe an actual case. Obviously, in actual practice such an addition of off-center weight would be counter-balanced so that no list would remain on the ship after the alteration. The determining, correcting, and plotting of the series of points to provide the final stability curve is laborious and time-consuming. A method which simplifies the amount of work to be done and yet preserves the accuracy of the results is greatly to be desired. Such a method is described in Chapter XII.
63
Figure 7-4. Final curve of righting moments as per step eleven in Article 7-5.
7-6. Weight removal. To compute and analyze the effects of a weight removal, the same sequence as that presented heretofore for weight addition should be followed. Most of the operations and results will be found just the reverse of those which relate to adding a weight. The steps are as follows:
1. The new displacement is W - w, where W is the original displacement, and w is the weight removed.
2. The new draft is found in the displacement curve.
3. The vertical shift of G is found from:
GG1 = wz / (W - w).
Where: z = the vertical distance from original G to center of gravity of the weight removed.
4. New KG1 = KG ± GG1. If the location of the weight removed was below G, then GG1 is plus. But if the weight removed was above G, then GG1 is minus when applied to KG.
5. The new KM1 is found in the curves of form.
6. New G1M1 = KM1 - KG1.
7. Uncorrected GZ curve is taken from the cross-curves in same manner as in weight addition.
8. This curve is corrected for new KG1.
9. Athwartship shift of G is found from:
G1G2 = wd /(W - w).
Where: d = the athwartship distance from ship's centerline to center of gravity of the weight removed.
10. Curve of G1G2 X cos θ is deducted from the GZ curve.
11. Multiply final righting arms by W - w to obtain a curve of righting moment.
12. Angle of permanent list is the angle where the residual stability curve begins. Or it may be calculated (if less than 10°) from the formula:
tan θ = wd / ((W - w) G1M1).
13. Stability characteristics are analyzed as for weight addition.
7-7. Alternative formula for KG. In steps three and four, Article 7-3, the new height of the ship's center of gravity was found by computing GG1 and adding or subtracting from KG. This method is simple for a single weight addition. However, if a number of weights are to be added and/or subtracted in various locations, it will be found convenient to make use of an alternative formula which performs the operation in one step (see fig. 7-1). This alternative formula is as follows:
KG1 = ((W X KG) ± wh) / (W ± w)
64
Where:
KG1 = new height of G above keel (feet).
W = old displacement of ship (tons).
KG = old height of G above keel (feet). w = weight added or removed (tons). h = height above keel at which w is to be added or removed (feet).
If a weight is added, wh above the line and w below the line are plus in the formula. But for a removed weight, wh and w are minus in the formula. If a number of weights are to be added and/or subtracted, then add or subtract wh for each weight above the line, and add or subtract w for each weight below the line.
65
CHAPTER VIII
THE EFFECTS OF LOOSE WATER
FREE SURFACE EFFECT ON TRANSVERSE STABILITY
8-1. Definitions. When a tank or compartment in a ship is partially full of liquid which is unimpeded in moving as the ship heels, the surface of the liquid tends to remain level. In such case the surface of the free liquid is spoken of as free surface; water in the compartment is called loose water.
8-2. Effect of free surface on stability. Free surface in a ship always causes a reduction of GM and a consequent reduction of ship's stability. This is superimposed on any added weight effect that may be present due to taking liquid aboard. Should free surface exist, a free surface correction must be considered in any stability calculation. On the other hand, if a tank is completely filled, having no free surface, the liquid in it may be treated as though it were a solid with the center of gravity of the liquid at its center of volume. In the latter case, no special consideration of the liquid's effect on stability, beyond weight effect, is involved.
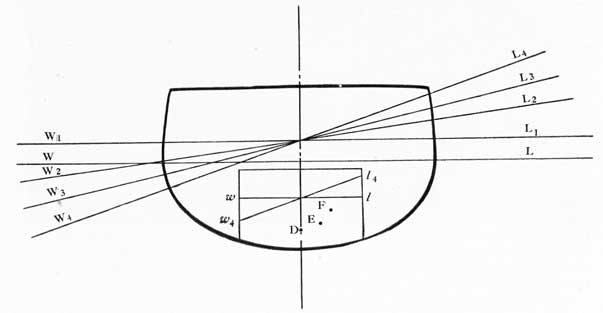
8-3. Visualization of free surface effect. In order to visualize the sequence and interrelationship of the actions that take place because of free surface effect, consider a centerline compartment partially full of water, as shown in figure 8-1.
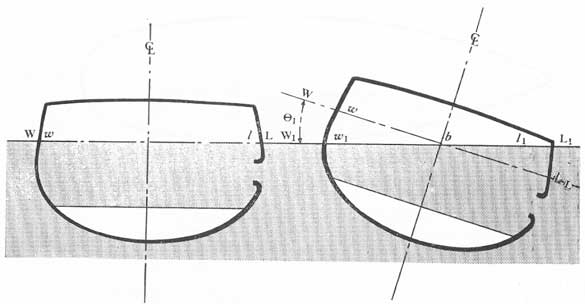
Originally, the ship is floating on an even keel at waterline WL. Then the compartment is partially flooded to a waterline wl, (not in free communication with the sea). Assume that the water enters the compartment instantaneously and is simultaneously frozen solid. The effects of this frozen body of water will be the same as if a solid weight of equal amount and location had been added; that is, the ship will undergo parallel sinkage until she comes to rest at a new waterline, W1L1. Next, some outside inclining moment acts on the ship, causing it to heel over at some small angle of list to a new waterline, W2L2. This inclining moment may be due to wind or wave action. Now suppose that the liquid is freed from its imagined solidity. Since the ship has been inclined, the liquid in the compartment will run toward the low side until
Figure 8-1.
66
Figure 8-2.
the surface of the water is parallel to the existing waterline W2L2. This shifts a wedge of liquid from one side of the tank to the other, bringing about a shift in the center of gravity of the whole body of liquid from D to E. Since the center of gravity of this liquid has shifted outboard, an inclining moment is caused by the liquid in addition to that outside inclining moment which originally caused the ship to heel. The ship thereupon will list to a new waterline, W3L3. This additional list in turn causes a further shift in the liquid filling the compartment. This step-by-step visualization may be continued until the ship comes to rest at some waterline W4L4, where the righting moment of the ship is equal to the combined effect of the original outside inclining moment and the added inclining moment due to shift in the center of gravity caused by the presence of a free surface.
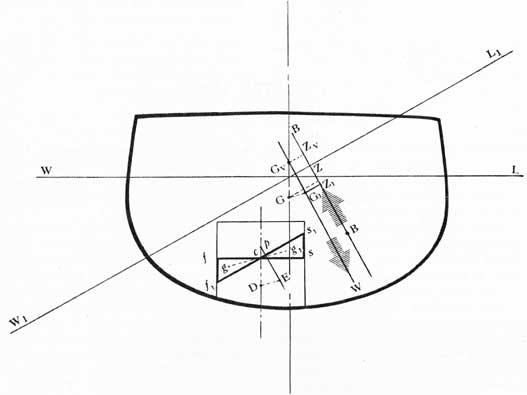
8-4. Evaluation of free surface effect. The vessel in figure 8-2 has a tank which is partially filled with sea water. G is the location of the ship's center of gravity after the water is in the ship.
The center of gravity of the water (in the tank) will be at some such point as D when the vessel is upright.
At any small angle of inclination of the vessel such as θ, a wedge of liquid will shift from fcf1 to s1cs. Calling g the center of gravity of the port wedge and g1 the center of gravity of the starboard wedge, the shift of weight is along the path of gg1. Drawing the line of action of the liquid through D when the ship is upright, and then drawing the line of action of the weight of the liquid through E when the ship inclines to the small angle θ, the two successive lines of action will intersect at some point such as p. This point p is above both D and E; as the ship heels over, although the actual mass of the loose water lies in a series of points such as D, E, etc., the line of action of the weight of the water acts through point p. The water is behaving as if its center of gravity were at p rather than at D or E, creating the same effect as a pendulum. Therefore, we refer to p as the "virtual" center of gravity of the loose water, saying that there has been a "virtual rise" in the mass of the water.
It can be shown that p can be located by the relationship:
Dp = i/v.
67
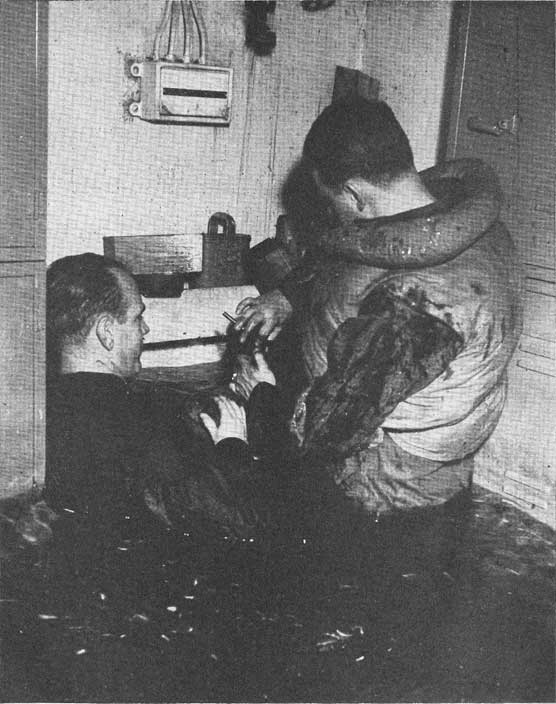
Figure 8-A. Plugging holes preparatory to pumping out loose water.
Where: Dp = height of D above p in feet. i = the moment of inertia of the surface of water in the tank about a longitudinal axis through the center of area of that surface. v = the volume of water in the tank.
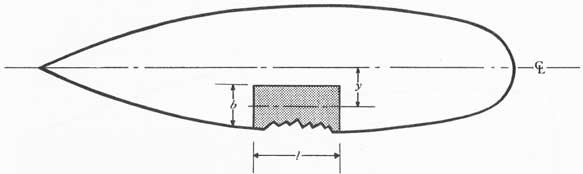
For a rectangular tank in which:
b = athwartship breadth (feet). l = fore-and-aft length (feet). i = b3l/12 feet4.
68
Figure 8-3. A stability curve corrected for free surface.
(Most compartments aboard ship are rectangular in shape.)
Due to the actual movement of a wedge of water from g to g1, there will be a corresponding shift in the actual center of gravity of the ship from G to some such point as G1, which is along a path parallel to gg1. This reduces the righting arm from GZ to G1Z1. The ship would have the same righting arm at this angle of heel if the center of gravity had risen on the centerline to a position Gv (fig. 8-2). This position may be called the "virtual center of gravity"; i.e., the ship behaves as though the center of gravity were at Gv.
Virtual rise in the center of gravity (GGv), may be considered as resulting from the behavior of the loose water as though it were a pendulum suspended at p. Hence, GGv may be obtained as follows. The weight of the water may be taken to be at p. This will cause a rise in G to point Gv.
GGv = (Dp X v) / V = i/V.
Where: V = existing volume of displacement of the ship (35W), in cubic feet. The point Gv may be referred to as the virtual center of gravity of the ship, and KG, as the virtual height of G above the keel.
The effect of free surface on the ship's initial stability (GM), is the same as the effect of raising a
weight equal to that of the water in the tank through a vertical distance Dp. Thus, there is always a reduction in GM due to free surface effect, which is equal to:
GGv = (-) i/V feet.
The loss of righting arm at an angle of heel due to this virtual rise in G is GGv X sin θ, as indicated in figure 8-2. It is thus established that loose water may be regarded as causing a virtual rise in G, which is reflected in an actual reduction of righting arm. This reduction is equal in magnitude to:
Loss in GZ = i/V X sin θ = GGv X sin θ.
Figure 8-3 shows a stability curve which has been corrected for this loss of righting arm.
Actually, the formula, loss in GZ = (i/V) sin θ, holds true only for small angles of heel. Its accuracy is reduced as the angle of heel increases, due to pocketing discussed in Article 8-10 below; but the use of the above relation will show more loss (at large angles) than has actually occurred.
The resultant general effect of free surface has been to lessen the ability of the ship to right herself.
8-5. Density of the liquid in relation to free surface effect. In case several tanks have free surface,
69
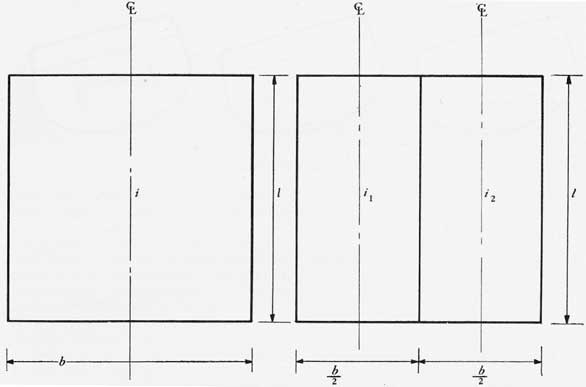
Figure 8-4. Sketch showing two free surfaces with the same overall dimensions; in the right-hand figure a centerline, longitudinal, watertight bulkhead is represented.
their surface moments of inertia are calculated individually and added. Then the sum is used in the correction for free surface. Should the tanks contain fresh water, oil, gasoline or any other liquid which does not have the same density as the water in which the vessel is floating, the moment of inertia of the free surface of the liquid in each tank is multiplied by the ratio of the density of the liquid to that of the outside water. For example, if the tanks contain fuel oil (density 1/37 tons per cubic foot) and the vessel is floating in sea water (density = 1/35 tons per cubic foot), the moment of inertia of the surface of the oil should be multiplied by the correction factor 35/37. In the case of fuel oil and fresh water the effect of density is used only in accurate calculations.
8-6. Depth of water in a compartment in relation to free surface effect. Of itself, the free surface effect of a given area of loose water at a given angle of heel is entirely independent of the depth of liquid in the tank or compartment. It does not matter whether the liquid is one foot deep or three feet deep, the reduction in GM due to the presence of a free surface will be the same. This is apparent in the formula, where the only factors are the dimensions of the surface and the
displacement of the ship (assuming sea water, with a density of 1/35 tons per cubic foot is the liquid in the compartment in question).
8-7. Location of free surface in relation to its effect. Just as the effect of free surface on GM (initial stability) is independent of the depth of liquid, so is it independent of the location of the liquid in the ship. A given area of free surface, with a certain length and breadth, at a given angle of heel, will cause the same reduction in GM and stability characteristics whether it is forward or aft, high or low, on the centerline or off the centerline. This is true as long as the boundaries are intact.
8-8. Influence of the breadth of free surface upon its effect. The strong influence of the breadth is evident, since i (and therefore the free surface effect) varies as the cube of the breadth, b, but only as the first power of the length l. A single fore-and-aft bulkhead which cuts a tank in half will quarter the free surface effect. For example, in the left-hand sketch of figure 8-4:
i = b3l / 12
70
Figure 8-5. Diagram to illustrate pocketing of free surface.
Assuming that the sketch represents a compartment eight feet square:
i = 838 / 12 = (512 X 8) / 12 = 4,096 /12 = 341.3.
In the case of the right-hand sketch (same dimensions):
i = i1 + i2 = (43 X 8)/12 = (43 X 8) / 12.
= (64 X 8) /12 + (64 X 8) /12 = 85.33.
8-9. Longitudinal bulkheads and free surface effect. As may be inferred from statements in Article 8-8, free surface effect is serious in wide compartments extending all of the way (or most of the way) across the ship, and is relatively unimportant in narrow compartments. From the standpoint of free surface effect only, the installation of longitudinal bulkheads would seem desirable. However, the fact is that off-center flooding after damage thus becomes possible, causing the ship to take on a permanent list after damage, and usually bringing about a greater loss in stability than would be the case if the bulkhead were not there. It may be noted that this potential disadvantage of longitudinal bulkheads can be minimized if the off-center spaces can always be kept filled.
8-10. Important variables which may modify free surface effect.
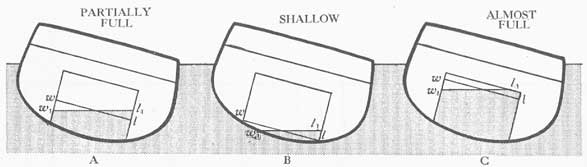
Beneficial effect of pocketing.
There is one way in which depth and larger angles of heel combine to modify the free surface effect. In figure 8-5A observe that the breadth wl is not as great as w1l1 and since i/V varies as the cube of b, the free surface effect is noticeably increasing as the ship heels. The opposite of this will occur in the case shown in figure 8-5B, where the shallow layer combined with a large angle of inclination causes the liquid to run into a corner of the compartment, reducing the breadth from wl to w1l1, and thus very markedly reducing the free surface effect. This is known as pocketing of the
free surface. A similar effect is shown in figure 8-5C, except that in this case the compartment is almost filled with liquid.
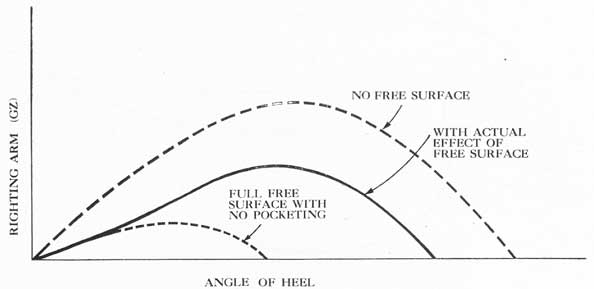
As the ship heels to greater and greater angles, pocketing diminishes the loss calculated in the formula (i/V) sin θ, by cutting down the size of the wedges that shift across the compartment. The normal practice of carrying fuel oil tanks 95% full represents a case similar to that shown in figure 8-5C, in which pocketing occurs, preventing excessive free surface effect as the ship rolls. Figure 8-6 shows what happens when the free surface is pocketed at some angle of heel, diminishing its adverse effect.
No known method of evaluating pocketing would have sufficient speed and simplicity for use in damage-control procedure. But since pocketing improves stability, neglecting it when computing stability allows a margin for safety. It is likewise impracticable to compute the increase in i as the ship heels for tanks filled to a level similar to that shown in figure 8-5A. For small angles of list the difference is slight. Therefore, the decrease in GM and the virtual rise in G are usually based on measurements of length and breadth of free surface area which apply to the ship on an even heel.
Harmful effects of piercing longitudinal bulkheads.
Swash bulkheads (that is, non-tight bulkheads pierced by drain holes) are fitted in deep tanks and double bottoms to hinder the flow of liquid in its tendency to remain continuously parallel to the waterline the ship rolls. These swash bulkheads considerably diminish the free surface effect if the roll is fairly quick. But they will not reduce the free surface effect on a ship which, having a low GM, rolls slowly. Moreover, a ship that takes on a permanent list will incline just as far as if the swash plates were not there.
A casualty duplicating the effect of the swash bulkhead occurs when the fore-and-aft watertight bulkhead separating two adjacent compartments is
71
Figure 8-6. Stability curve of a ship with tank or compartment almost full or empty-free surface pocketed.
ruptured, so that flooding water is free to flow athwartship from one compartment to the other. In this case, it is incorrect to add the free surface effects of the two compartments together. An entirely new figure for free surface effect must be computed, regarding the two as one large compartment.
This situation can be duplicated by an open door in a longitudinal bulkhead, or by an open sluice valve connecting two adjacent side tanks divided by a longitudinal bulkhead. Both circumstances are serious, since the effective breadth of the free surface is now equal to the added widths of the two spaces involved.
Beneficial effect of surface permeability.
If a considerable quantity of solid matter in a compartment projects through and above the surface of the loose water (for example, stores in a cargo hold, ammunition, turbines, boilers, etc.) and if this solid matter is made fast so that it does not float around and is not permeable itself, then the free surface area and free surface effect will be diminished accordingly. It is obvious that this surface permeability effect will vary for different heights of water in the compartment, as well as for different types of compartments. Surface permeability may be expressed as a factor or ratio. When known, the surface permeability effect is accounted for by multiplying i by the factor, s, to obtain the actual reduction in GM due to free surface effect. For most compartments s varies between 95% and 100% and may be neglected. However, for certain others it is a factor that must be considered. Fire-rooms may have a factor varying from.95 to.60 (with
undamaged boiler casings), while for magazines completely stowed with powder tanks the value may be as low as.50. A cargo space may have surface permeability ranging all the way from.95 to.60, depending on the type and quantity of the cargo, the method of stowage, and the level of the water. It is obvious that surface permeability factor always has a beneficial influence because it reduces free surface. However, there are only a limited number of cases (important to be sure), in which its effect need be considered.
8-11. Effect on stability of taking liquids aboard ship. The addition of a weight of liquid with a free surface has two effects on the metacentric height. First, there is the effect on GM and GZ of the weight addition (considered as a solid); this will influence the vertical position of the ship's center of gravity, and the location of the transverse metacenter, M (due to bodily sinkage). Secondly, there is reduction in GM and GZ due to the free surface effect.
FREE COMMUNICATION EFFECT ON TRANSVERSE STABILITY
8-12. Definition. If one or more of the boundaries of an off-center compartment is extensively ruptured so that the sea may flow freely in and out as the ship rolls, a reduction in GM and GZ takes place which is superimposed on both the change due to the addition of flooding water weight and the reduction due to the free surface effect of partial flooding. This superimposed reduction may be referred to as free communication effect.
72
Figure 8-7. Diagram to illustrate free communication effect.
8-13. Visualization of the free communication effect. In order to visualize the sequence and interrelationship of the actions that take place because of free communication effect, let us consider an off-center compartment partially full of water and in free communication with the sea, as shown in figure 8-7. Note that this compartment is free to vent at the top.
Originally, the ship is floating on an even keel at waterline WL. Then the compartment is partially flooded, and remains open to the sea. Assume that the water enters the compartment instantaneously and is simultaneously frozen solid. The compartment is flooded up to the original waterline, WL. Then, as previously noted, the equivalent parallel sinking would be to some waterline such as W1L1. Considering the upsetting moment of the frozen water, the ship would assume some inclined position like that indicated by waterline W2L2. Now, if we assume that the water returns to a fluid state, not only will its surface assume a position a-b parallel to the external waterline, but since the flooding surface is below the external waterline, and since free communication with the sea exists, more water will flow into the ship until the waterline in the compartment coincides with the external waterline W2L2. Thus, superimposed on the weight effect of the initial flooding, we have not only the increase in upsetting moment due to the change in form of the free surface, but we also have an increase in the upsetting moment due to the additional water which flows into the compartment coincident with the listing of the ship. These two effects, additional to the initial weight effect, cause the ship to sink farther
in the water and to assume a greater list, thus bringing her to some such waterline as W3L3. The flooding water thereupon further changes its form and increases in amount, generating an additional upsetting moment which reacts upon the ship. These interactions continue until the ship assumes the position represented by W4L4, wherein the righting moment and the total upsetting moment are equal.
If the ship rolls away from the damaged side, the water will correspondingly flow out of the compartment, thus decreasing its upsetting moment; that is, as the ship moves in a seaway, the water will rise and fall in the compartment, tending to approximate the level of the external waterline.
8-14. Evaluation of free communication effect for an off-center tank or compartment. The reduction in GM due to free communication effect is approximately equal in magnitude to:
ay2 / V
Where: a = area of the free surface in square feet. a = bl, where b is breadth and l is length of free surface, as shown in figure 8-8.
y = perpendicular distance from the geometric center of the free surface area to the fore-and-aft centerline of the intact waterline plane in feet.
V = new volume of ship's displacement after flooding, in cubic feet.
Thus, reduction in GM is additional to, and separate from the free surface effect, and may likewise be multiplied by s to account for the surface permeability.
The approximate reduction in GZ may be computed
73
Figure 8-8. Plan view of a compartment in free communication with the sea.
Figure 8-9. Stability curve with correction for free communication superimposed on the corrections for added weight and free surface. It is assumed that the free communication effect is in pairs of identical wing tanks on opposite sides of the ship; hence there is no off-center weight, and no list.
according to the following formula, although the accuracy of the computation decreases as the angle of heel increases:
GZ = ay2/V sin θ.
This may be considered as a "virtual" rise in G, superimposed upon the virtual rise in G due to the free surface effect.
Figure 8-9 shows a stability curve, with correction for free communication superimposed upon corrections for added weight and free surface. Curve A is the original stability curve prior to flooding. Curve B represents the situation after flooding, and is based on new displacement and new height of G, but is not corrected for free surface or free communication effects. Curve C is Curve B corrected for free surface
effect only. Curve D is Curve B corrected for both free surface and free communication effects. Note that no list is assumed to exist.
8-15. The effect of free communication in the case of a centerline compartment. It should be noted that ay2/V becomes zero because y becomes zero when the compartment is symmetrical about the ship's centerline. This would indicate that when a centerline compartment, or one extending from side to side of the ship is opened to the sea, that only the free surface effect of the loose water and not the free communication effect will act to reduce GM. In figure 8-10, a wedge of water is shifted from wbw1 to lbl1 as the ship inclines. No additional water is admitted to the ship. Only the free surface effect is present.
74
Figure 8-10.
Figure 8-11.
However, if the deck on which the damage water rests is only a short distance below the waterline, more water will run into the flooded compartment as the ship is inclined away from the upright position. Thus, in figure 8-11, the surface of the loose water with the ship upright is wl. If boundaries are intact and the ship inclines, free surface is reduced to w1l1, due to pocketing. But if free communication with the sea exists as the ship inclines, more water runs in the hole and the surface of the water becomes w2l2. It is obvious that for a given inclining moment, θ2 will be greater than θ1 and the beneficial effect of pocketing will be reduced due to the facts that:
1. The free surface is greater.
2. There is more flooding water in an off-center position.
If values of (i/V) sin θ are deducted from the stability curve, they account for more loss of stability than is occasioned by either case mentioned above. 8-16. Sluicing. If two partially filled tanks on opposite sides of an intact ship are connected by an open pipe at or near their bottoms, the resulting free flow of liquid between them produces a serious reduction in stability. The loss in GM is equal to that which would be produced by having both tanks in free communication with the sea. Hence, valves in cross-connections between such tanks should never be opened without full anticipation of the accompanying decrease in stability.
8-17. Summary. In conclusion, the following facts relating to the Presence of loose water in a ship are emphasized:
75
1. Loose water always causes a reduction in stability characteristics due to free surface effect.
2. The breadth of the free surface area is the greatest single influence in determining the magnitude of stability loss.
3. Variables which may modify free surface effect are pocketing, piercing of longitudinal bulkheads, and surface permeability.
4. Free communication between the sea and a tank
or compartment having a free surface causes a further reduction in stability (always in the case of off-center compartments; sometimes in the case of centerline compartments).
5. Free communication effect is superimposed on the added weight effect (if water is also added to the ship), and the free surface effect.
6. Free communication almost always reduces seaworthiness.